Links to GIS information for test system design

If you are trying to design software that includes a Geographical element it is easier if you are working with data that makes some kind of sense.

The following are a list of sites where you can get good and consistent information on Local Authority Geographical Datasets within Scotland and in London. There has been an improvement in the quality and extent of information available but open data still remains patchy. Fortunately some datasets are available. The interesting thing about this data is that although it is rich it is largely unstructured and without relationships. Fortunately if there are geographical attributes then these can be used to spatialiy analyse the information and create relationships from which you can start to construct better systems.

I understand why the data is patchy. To really publish well it is a necessity to get your systems working well so that the export (and publication) of data can be at least semi-automated. Without this it is simply too onerous for staff to repeatedly perform Extraction Transformation and Load procedures on ever larger numbers of datasets. Taking a step back however therein may lie the benefit. The quicker they can learn to cleanly optimise and export and hopefully automate these procedures the more likely they are to have their systems working properly and importantly the more investigation and experimentation they can put into linking their datasets. The skills to link these datasets constantly to a web data portal being similar to the skills required to link between systems.

It might be expected therefore that better availability of open data is reflective of better internal systems.

Here is the information that I was able to identify through Google Searches at February 2018.

Aberdeenshire Open Data

Angus Council Open Data Portal

Argyll and Bute Open Data Portal

Dundee City Open Data Portal

Moray Council Open Data Portal

North Ayrshire Open Data Portal

North Lanarkshire Open Data Portal

South Ayrshire Open Data Portal

and scheduled ancient monument information can be obtained here.

Historic Environment Scotland

Here is London

London

Creation of SITE History from Planning Application Polygons using QGIS

In planning it is important to know the planning history on a site. The status and likelihood of approved permission will often relate to previous permissions. Many council planning systems do not specifically relate planning applications to each other and there may be situations where you would like to create such links. This is essentially an excercise in using spatial analysis to create the junction table to hold what are many to many relationships.

If your datasets are in any way large you will need to set aside a computer so that it can perform the calculations. When I first tried this the process took a weekend with queries running overnight.

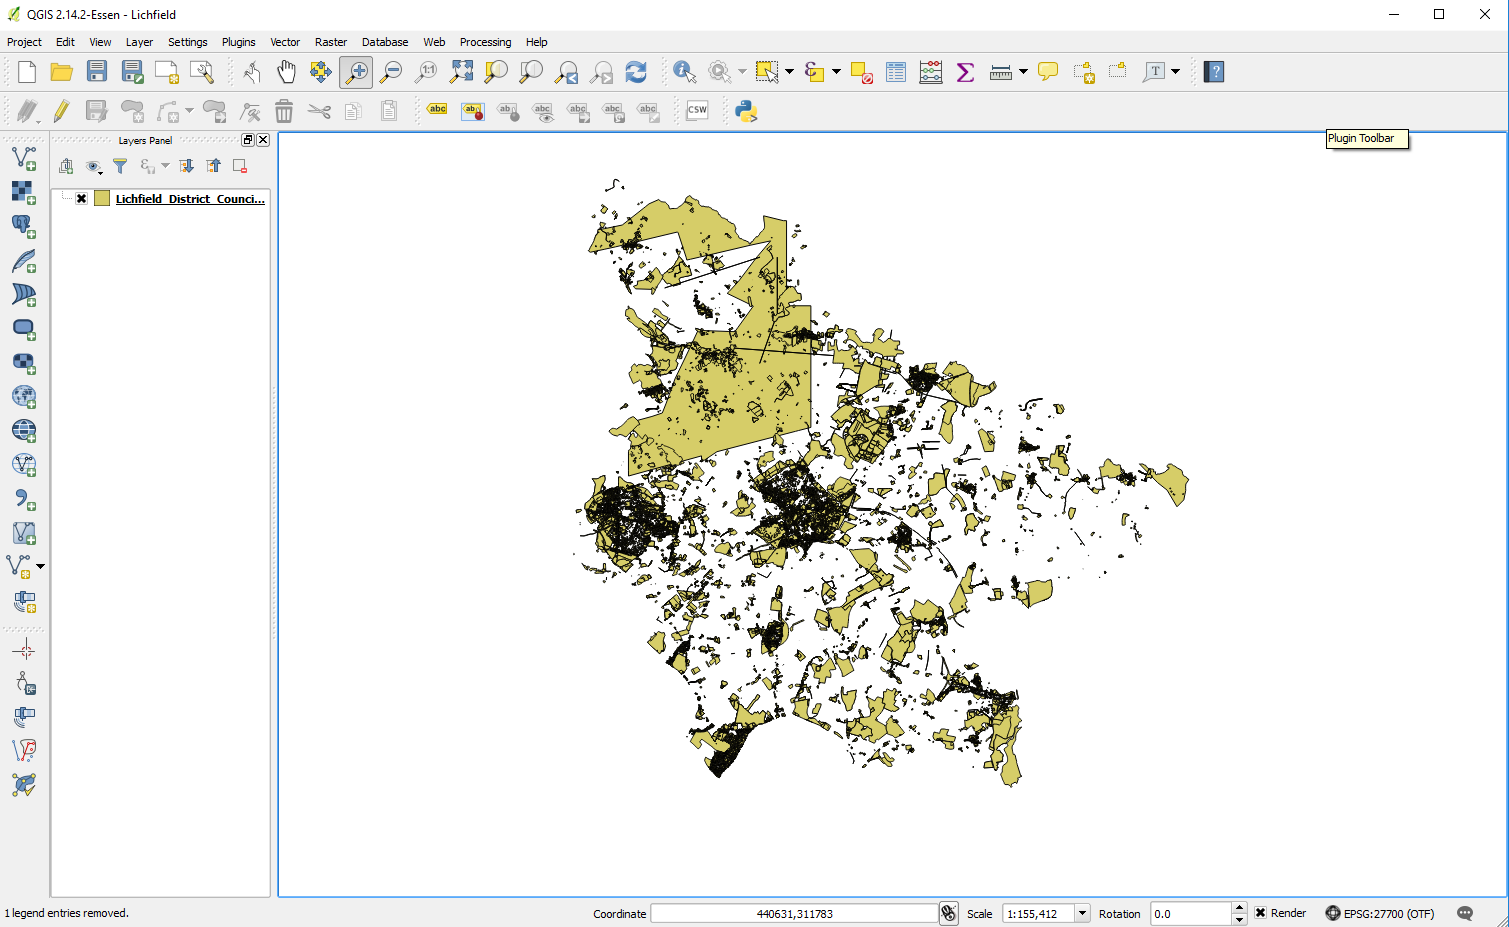
Start by obtaining as many years of planning application polygons as you can. Here I use polygon files in shape format.

The polygon file or shape file should be in one file so if you need to merge the shape files you have together. I did this and the file I ended up with was

AllPlanningApplications.shp

Next – Delete all attribute fields EXCEPT the planning application number.

Next – Create a centroids file from AllPlanningApplications.shp I called mine
AllPlanningApplicationsCentroids.shp

The next series of iterations are about getting a unique set of polygons with which we can go forward and generate a set of SITEPKIDS that can be attached to the child records.

Step – Using AllPlanningApplications.shp ADD an additional field called area and populate it using QGIS $area calculation – save this file.

Step – this is where it becomes interesting – in most authorities there are a vast number of planning application boundaries that overlap. Performing a dissolve at this point would result in a large congealed set of polygons that could not clearly identify unique sites. Thus buffering the polygons down we can start to identify unique sites. This is particularly important where boundaries are completely contiguous to each other.

sites the buffering command is used within the geometry tools to try to separate adjacent overlapping and contiguous polygons.

Step ‐ Create two files from the AllPlanningApplications.shp one for polygons less than 4500 metres squared and one for more than or equal to 4500 metres squared. This is to allow for two differing buffering processing to be performed on each.

AllSmallLessthan4500PlanningApplications.shp

AllLargeGreaterthanequal4500PlanningApplications.shp

Now the 4500 is an empirical figure that was subjectively chosen there may be a better figure feel free to investigate.

The following 2 steps also introduce empirical figures for the buffering that can be altered as appropriate.

Step ‐ Take the file AllSmallLessthan4500PlanningApplications.shp and create a buffer polygon file of this with

boundaries of less than 2m lets call it

AllSmallLessthan4500PlanningApplicationsBufferMinus2.shp

Step ‐ Take the file AllLargeGreatethanequal4500PlanningApplications.shp and create a buffer polygon file with

boundaries of less than 20m lets call it

AllLargeGreaterthanequal4500PlanningApplicationsMinus20.shp

THIS NEXT STEP WILL TAKE SEVERAL HOURS IT MAY BE BEST TO DO EACH ONE OVERNIGHT

Step ‐ Perform dissolves on both of these new files ensuring that dissolve all is used names could be something like

Vector / Geoprocessing Tools / Dissolve /

Set input layer alternatively to the two above files and set Dissolve field to dissolve all.

Suggested file Names are

MultipartDissolvedPolygonLessthan4500PlanningApplicationsBufferMinus2.shp

MultipartDissolvedPolygonAllLargeGreaterthanequal4500PlanningApplicationsMinus20.shp

Step You should now have two shape files of a large multipart polygon you want to perform the multipart to single part operation now

Vector / Geometry Tools / Multipart to Single Part

Processing involved with this is typically quick and suggested names for these files are

DistinctPolygonsAllSmallLessthan4500PlanningApplicationsMinus2.shp

DistinctPolygonsAllLargeGreatethanEqual4500PlanningApplicationsMinus20.shp

Add area column and identify the largest polygon on the small files

Add area column and identify the smallest polygon are on the large files you may want to remember this.

Step ‐ perform merge on these two files to get

Vector / Data Management Tools / Merge

CombinedSmallandLargeDistinctPolygonsPlanningApplicationswithbuffering.shp

ONGOING investigation ‐ would Difference be better than dissolve on this and should the above files be put together before

Step ‐ perform dissolve

Vector / GeoprocessingTools / Dissolve

ensure that ‐‐Dissolve all‐‐ is selected

DissolvedCombinedSmallandLargeDistinctPolygonsPlanningApplicationswithbuffering.shp

Step now you want to split mutlipart to single

DistinctPolygonsAllPlanningApplications.shp

Step add field called SitePKID and populate it using $rownum command.

Step

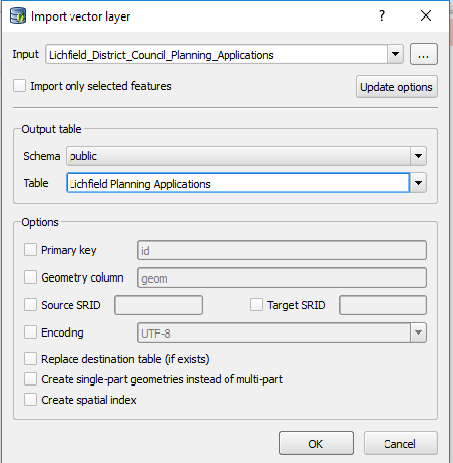
Vector / Data Management Tools / Join Attributes by Location

Set Target Vector Layer as

AllPlanningApplicationsCentroids.shp

Set Join Vector Layer as

DistinctPolygonsAllPlanningApplications.shp

Ensure that Keep all records (including non‐matching target records are kept)

Output Shapefile suggestions

AllPlanningApplicationsCentroidswithSitePKID.shp

If there are centroids without Site PKIDs put them to the end and give them consecutive unique row numbers. The attribute file associated with AllPlanningApplicationsCentroidswithSitePKID.shp should now be a child table of the shape file DistinctPolygonsAllPlanningApplications.shp perform checks here to see if all centroids within a polygon defined by the distinct polygons have the same SitePKID and that it is matched by the SitePKID of the Parent shape file.

You should be able to do a join on the this file to get the PKID back into the very original file.

AllPlanningApplications.shp

Finally perform a dissolve on the corrected AllPlanningApplications.shp file but this time dissolve on the field

SitePKID

You can call this

DistinctCorrectedPolygonsAllPlanningApplications.shp

QED!!!!

QGIS – Import shape file into PostGIS Table

The following uses
QGIS 2.14.2 Essen and
PostGres 9.5

A number of local authorities have released information through the UK’s data government site. The following example uses a shape file obtained from Lichfield District Council – At 2nd of October 2016 this was available for download from the following link

Lichfield Planning Applications

Open up QGIS and add Lichfield’s planning application shape file
qgisessen2142

Now scan along the top menu and go to Database

Select the sub menu DB Manager and then DB Manager

dbmanager

The following windows dialog should appear

dbmanagerdialog

Expand the area on the left named PostGIS – any PostGIS instances that you have created should be visisble here. Note you will have to have the PostGIS server running. Then highlight the actual instance that would like to import information into.

In this case I use the instance LocalPostGres

dbmanagerdialog

Choose the third icon from the left.
dbmanagerimportlayerfile

It should be noted that the window on the right may or may not show the correct connection to the database on the right.

importdialog

Name the table you wish to create and then hit OK – additional parameters are available.
There will be a delay before a confirmation of successful import happens – try to not issue commands during this time – once confirmation has been received go back into the PostGIS option and add the layer.

QGIS 2.8.1 – Useful Functions and Operators – Field Calculator

Calculate eastings and northings of centroid within polygon layer
xmin(centroid($geometry))
ymin(centroid($geometry))

Calculate area and perimeter of a polygon layer
$area
$perimeter

Calculate eastings and northings of a point layer
$x
$y

Calculate the length of a line layer
$length

Capitalise column values
upper(Field)
eg upper(Town)
Edinburgh becomes EDINBURGH

Camel case column values
title(Field)
EDINBURGH becomes Edinburgh
DUDDINGSTON LOCH becomes Duddingston Loch

Lower case column values
lower(Field)

Replacethis withthat in string
replace(string, replacethis, withthat)

Concatenate string a and string b
Concatenate a || b

Division and next line Multiplication
a/b
a*b

area/10,000 – divides area field by 10,000 (eg going from m2 to Hectares

Remove decimals from a field
toint(area)
eg 7954.235 becomes 7954 and 456525.325 becomes 456525

Index a set of polygons
$rownumber

Functions and Operators Official Notes for Field Calculator

Introduction to Basic Printing QGIS 2.2

Creating maps that you can pass on to others is often a central and regular requirement if not in paper format then in a digital format that can be e-mailed or printed out. Here’s a quick reference for myself as much as anything else.

To get into the print composer you can create a completely new print composition or alternatively load an existing print composition – Generally the 5th icon in the main menu bar will take you there (should be a white landscape rectangle with a star will give you access to the print composer , demonstrated below;

The 6th icon can be used to get to an existing declared print composition.

PrintComposerDemonstrationEnvironment

Now in the first instance you are going to want to navigate around the map and ensure that the map you wish to produce has the correct extents. In the below image on a 2 screen image I show QGIS v2.2 open on the left screen and the print composer open in the right. To move the composition area around go to the map window within the main program and navigate accordingly. Then within the print composer window hit the command button titled

Set to map canvas extent

This will re-draw your composition with an interpreted boundary defined directly from you map window. You can enforce scale in the item properties. Similarly after changing layers you will need to ensure that you hit the above button again when you want the composition to reflect the layers within the map window.

QGIS – Free GREAT Digital Mapping Software

windglobe A map showing winds over the Atlantic

Looking for a desktop digital mapping package? You really need to check out QGIS it is an absolutely excellent open source geographical information system. At the time of writing the latest version was QGIS 2.4 – the below tips were taken from research into windows version of QGIS 2.2

Full program available here.
Link to www.qgis.org site (English)

Tip : Navigation – Magnification – Plus or Minus mangifier Icons or wheel scroll
Tip : Navigation – Scroll – cursor keys or alternatively the hand icon or hold down the space bar and movement of the mouse when pointer is in the map window.
Tip : Projection – CRS stands for Coordinate Referencing System – lots of different ways of showing what is essentially the surface of a sphere on a flat surface – and more generally referred to as map projection – you will remember from geography. For most UK maps the coordinates are often in Ordnance Survey UK Grid therefore you want the properties of Coordinate Referencing System of the project to be OSGB and you want the coordinate referencing system of the individual layers to be OSGB as well. Once this is done the scaling will be correct and so will the measurement tools.
Tip : View / Panel – allows you to switch on and off menus – very good and very powerful
Tip : Graphical Record selection – Icon in the middle of the toolbar that has a number of differing options – it’s a drop down that allows different things for selection.
Tip : Attribute Record selection – Icon in the middle of the toolbar that allows for table attribute selection. Shows the table and this can be sorted properly.
Tip : Deselect Records – can individually de-select using the keyboard alternatively you can also use the de-select icon in the middle of the top of the screen.
Tip : Browser – brilliant for navigating through the directory and seems a lot quicker than going through the pop up individual menus on the left – for me anyway – additionally you can add an additional browser layer and transfer things between directories. It is an excellent alternative to the file dialogue manager.
Tip : View / Decorations – You can add things like scale bar and copyright to the map window here – very intuitive and nice finishing touch to your projects.
Tip : Labelling – Make scale dependent – highlight the layer you are interested in and right click. Now select the Labels option and within the Size section change the drop down from points to map units.
Tip : Labelling – Threshold the labelling – right click on layer and then go to the Rendering section and select scale based visibilty and adjust accordingly.

Above interpreted from the QGIS manual see:
Link to PDF version of QGIS v2.2 manual