Introduction to Basic Printing QGIS 2.2

Creating maps that you can pass on to others is often a central and regular requirement if not in paper format then in a digital format that can be e-mailed or printed out. Here’s a quick reference for myself as much as anything else.

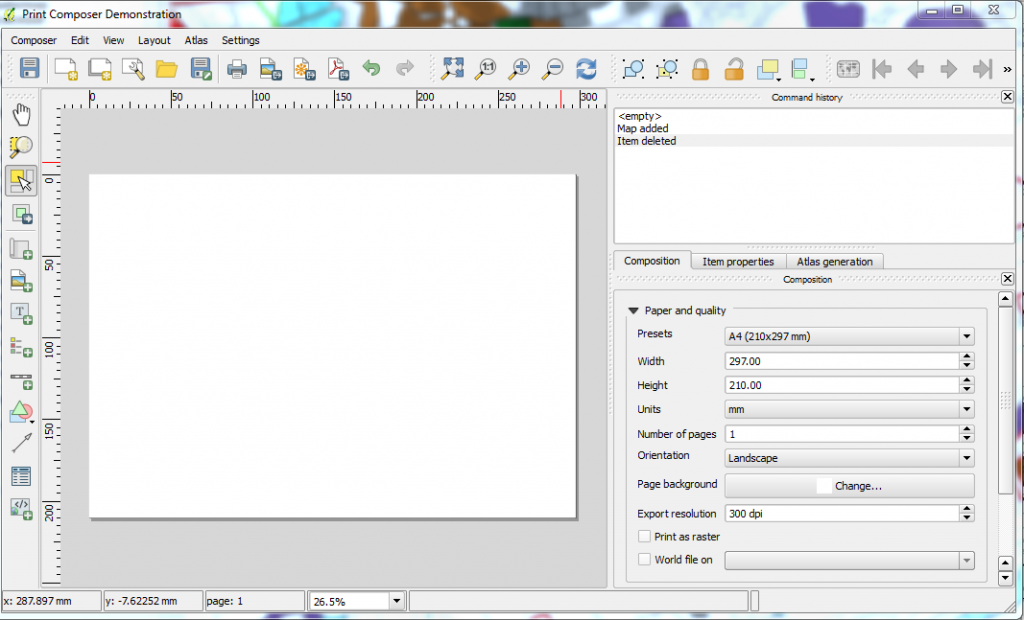
To get into the print composer you can create a completely new print composition or alternatively load an existing print composition – Generally the 5th icon in the main menu bar will take you there (should be a white landscape rectangle with a star will give you access to the print composer , demonstrated below;

The 6th icon can be used to get to an existing declared print composition.

PrintComposerDemonstrationEnvironment

Now in the first instance you are going to want to navigate around the map and ensure that the map you wish to produce has the correct extents. In the below image on a 2 screen image I show QGIS v2.2 open on the left screen and the print composer open in the right. To move the composition area around go to the map window within the main program and navigate accordingly. Then within the print composer window hit the command button titled

Set to map canvas extent

This will re-draw your composition with an interpreted boundary defined directly from you map window. You can enforce scale in the item properties. Similarly after changing layers you will need to ensure that you hit the above button again when you want the composition to reflect the layers within the map window.

QGIS – Free GREAT Digital Mapping Software

windglobe A map showing winds over the Atlantic

Looking for a desktop digital mapping package? You really need to check out QGIS it is an absolutely excellent open source geographical information system. At the time of writing the latest version was QGIS 2.4 – the below tips were taken from research into windows version of QGIS 2.2

Full program available here.
Link to www.qgis.org site (English)

Tip : Navigation – Magnification – Plus or Minus mangifier Icons or wheel scroll
Tip : Navigation – Scroll – cursor keys or alternatively the hand icon or hold down the space bar and movement of the mouse when pointer is in the map window.
Tip : Projection – CRS stands for Coordinate Referencing System – lots of different ways of showing what is essentially the surface of a sphere on a flat surface – and more generally referred to as map projection – you will remember from geography. For most UK maps the coordinates are often in Ordnance Survey UK Grid therefore you want the properties of Coordinate Referencing System of the project to be OSGB and you want the coordinate referencing system of the individual layers to be OSGB as well. Once this is done the scaling will be correct and so will the measurement tools.
Tip : View / Panel – allows you to switch on and off menus – very good and very powerful
Tip : Graphical Record selection – Icon in the middle of the toolbar that has a number of differing options – it’s a drop down that allows different things for selection.
Tip : Attribute Record selection – Icon in the middle of the toolbar that allows for table attribute selection. Shows the table and this can be sorted properly.
Tip : Deselect Records – can individually de-select using the keyboard alternatively you can also use the de-select icon in the middle of the top of the screen.
Tip : Browser – brilliant for navigating through the directory and seems a lot quicker than going through the pop up individual menus on the left – for me anyway – additionally you can add an additional browser layer and transfer things between directories. It is an excellent alternative to the file dialogue manager.
Tip : View / Decorations – You can add things like scale bar and copyright to the map window here – very intuitive and nice finishing touch to your projects.
Tip : Labelling – Make scale dependent – highlight the layer you are interested in and right click. Now select the Labels option and within the Size section change the drop down from points to map units.
Tip : Labelling – Threshold the labelling – right click on layer and then go to the Rendering section and select scale based visibilty and adjust accordingly.

Above interpreted from the QGIS manual see:
Link to PDF version of QGIS v2.2 manual