
Objective here is to write a series of queries that can be used to measure the shortest distance between selected paired locations on a network such that the geometry of the routes can be calculated and displayed on a map.
For this particular tutorial you will need – QGIS 3 or higher and a version of Postgres I am using version 11.0 here (I have upgraded since my former posts). I believe this tutorial will work with previous versions but if you are following along now might be a good time to upgrade.
QGIS 3.4 or higher – needed as the Ordnance Survey road network geometry contains a z coordinate which will prevent the creation of the required geometry for measurement. QGIS 3 introduced the ability to save geometry excluding z coordinate. If you have a network without z coordinates you should not require this.
So let us first get the data. Here you tick the option in the top right hand corner – scroll to the bottom and submit your request after which you will be asked a few basic questions along with email address you wish the download to be sent to after a few minutes you should be sent the download link through your email – follow the instructions and you should be able to get the information
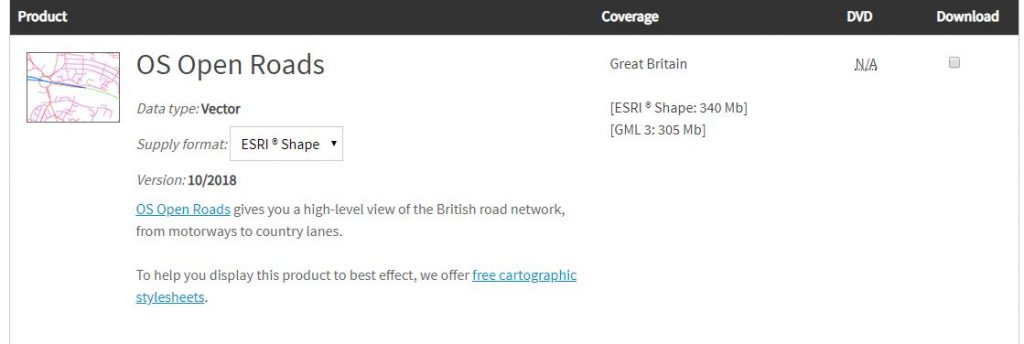
The information you are downloading is a block framework for the whole of the uk. When you unzip the download into a folder you will see multiple files. We will be using a section of the national dataset relating to Edinburgh – NT. Choose the block or selection that you are interested in. More blocks may take more time however.
Open QGIS
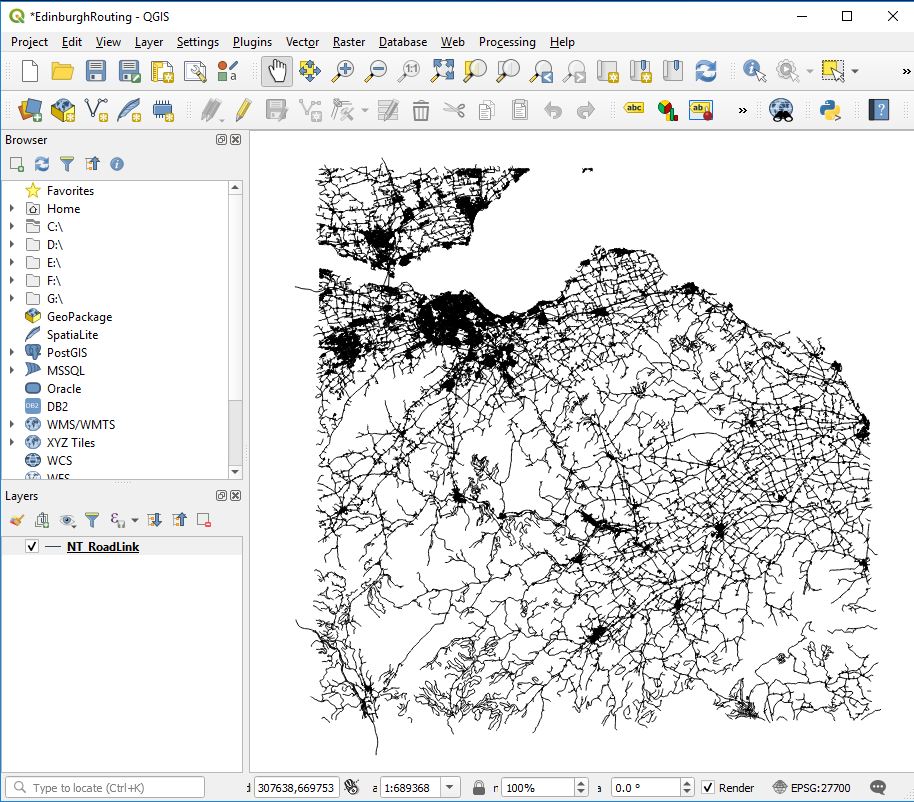
Create a new project : eg EdinburghRouting.qgz
Load in your chosen network block : eg NT_RoadLink.shp
Select the layer you just loaded in : eg NT_RoadLink.shp
and navigate to the following in the menu settings
Layer / Save As
Fill out the Save Vector Layer as … dialog box
IMPORTANT – ensure within the Geometry section
Geometry type is set to LineString
Include z-dimension is unticked
Give the new file a name : eg ntosroutingnetwork.shp
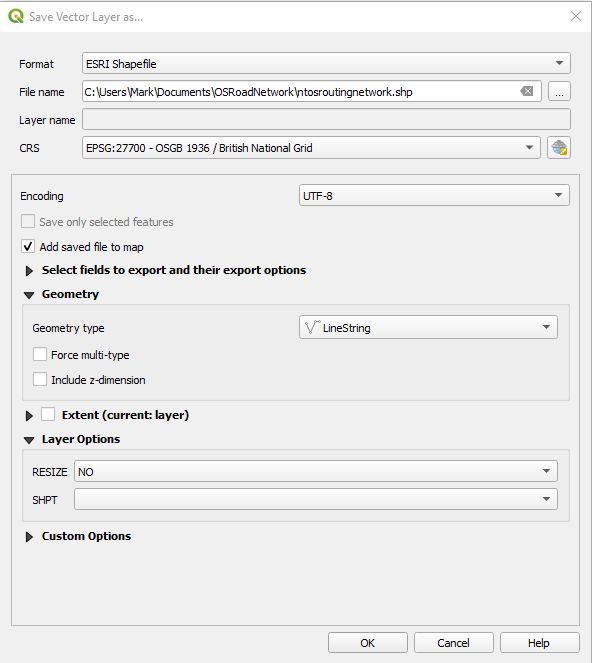
Hit ok
Within the layer dialog of QGIS your new layer should appear you can now remove the for NT_RoadLink shape file from the project
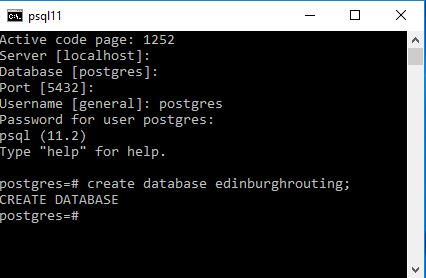
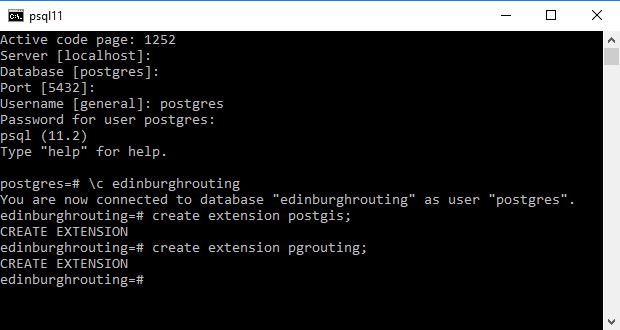
Next go to your version of PostgreSQL and using a superuser account create a new database : eg edinburghrouting
I would suggest you use lower casing as well
As a superuser ensure you add the postgis and pgrouting extensions.
Next I set up the following connection between the QGIS project and PostgreSQL
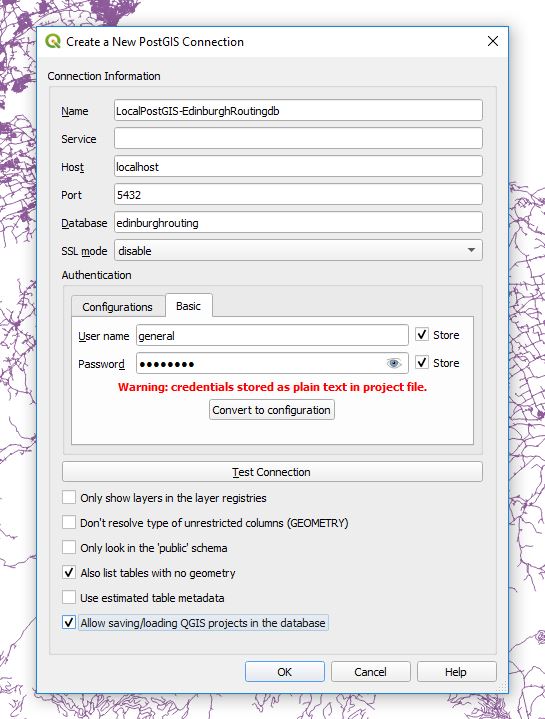
Personal tastes may vary but I like like to select
Also list tables with no geometry
Allow saving/loading QGIS projects in the database
OK the selection and you should now have a connection to the new database you just created.
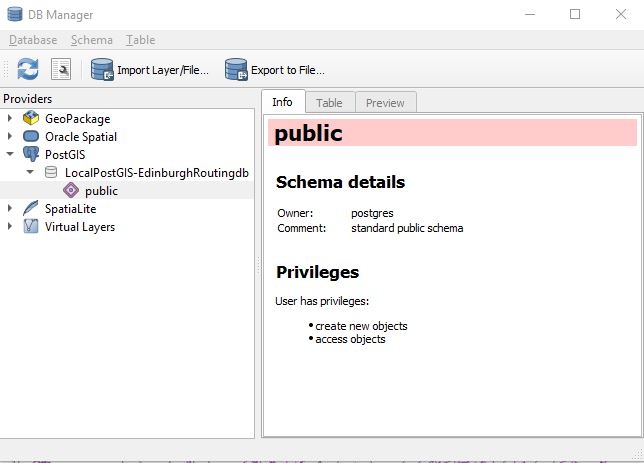
QGIS has an excellent dbmanager window which we will use to load our new shape file which excludes the z layer into the new database we created in PostgreSQL
Ensuring that you have a connection to your localpostgis database hit the
ImportLayerFile
Here I load the information into a new table t01roadnetwork

On pressing OK there will be delay after which if things go well you will receive the following message.

As ever it is good to check that things appear to be going well.
Add the layer to your project and determine approximately whether import was successful.
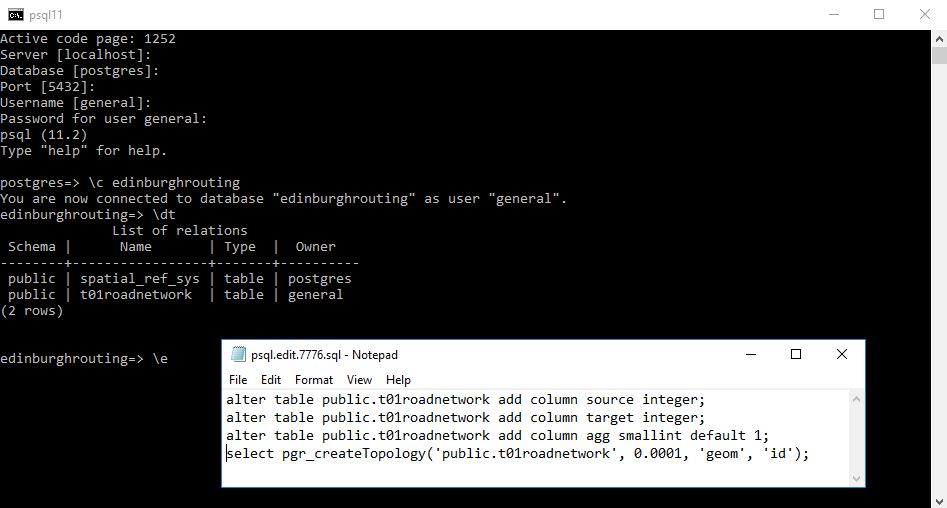
Next back in psql command line and in an editor we are going to run 4 queries
The first 2 add columns that are required in the shortest distance algorithm we shall use, the third will allow anyone to write an aggregation function to see the total cost of the route and the last creates a topology for the road network.
alter table public.t01roadnetwork add column source integer;
alter table public.t01roadnetwork add column target integer;
alter table public.t01roadnetwork add column agg smallint default 1;
select pgr_createTopology('public.t01roadnetwork', 0.0001, 'geom', 'id');
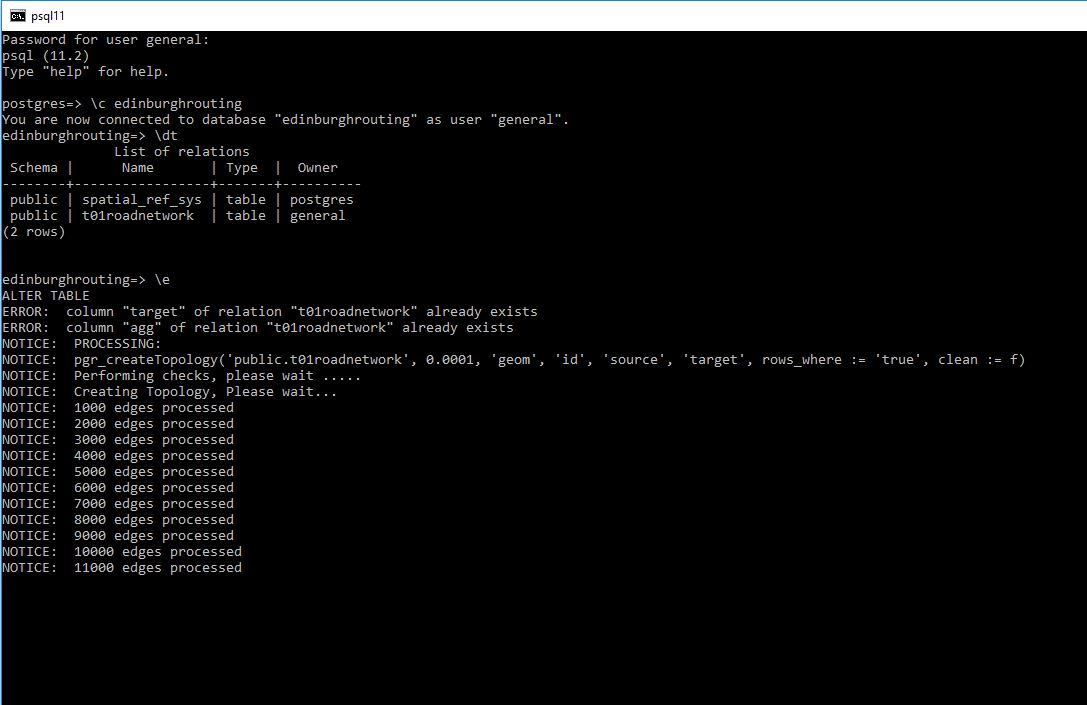
If things go correctly you should see the database engine start to create the topology and what I see is it gradually stepping through the creation process.
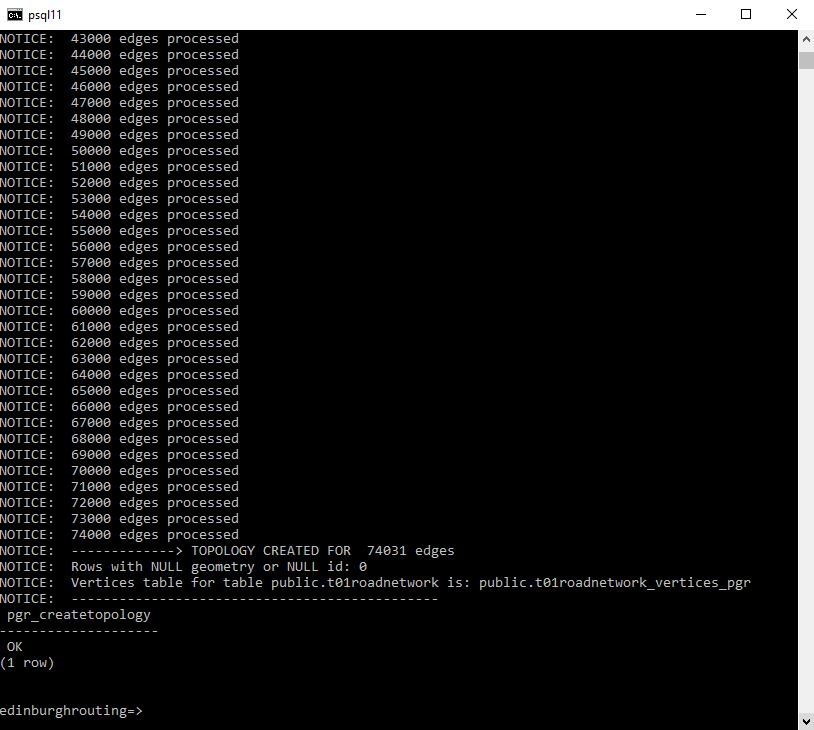
and on completion you should have something like the following:
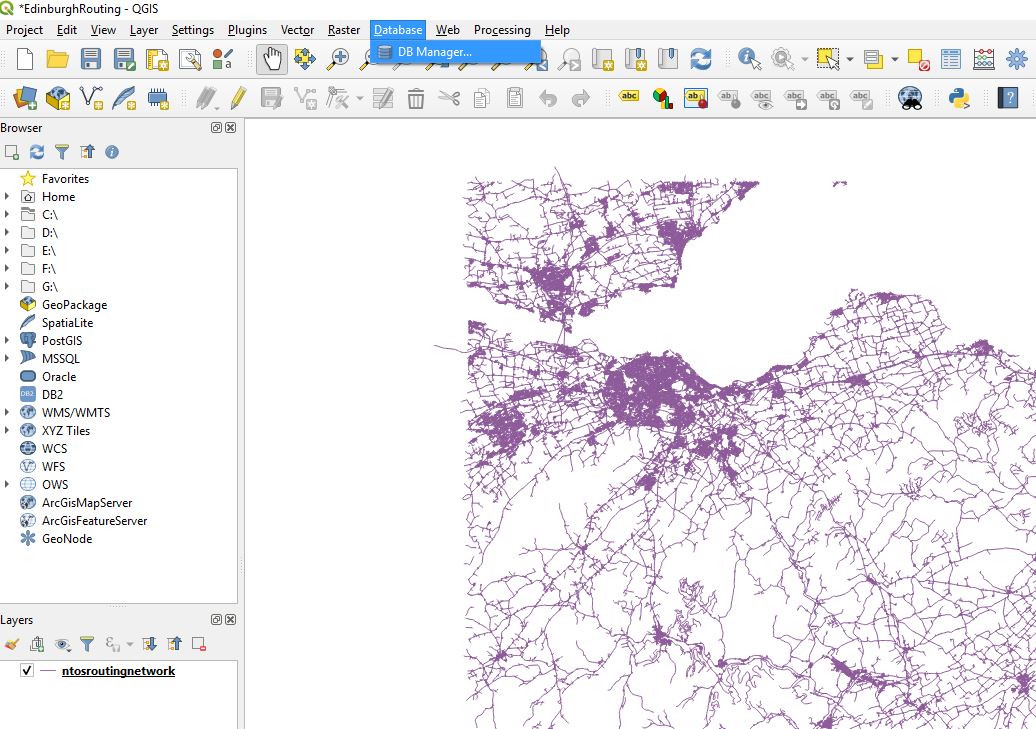
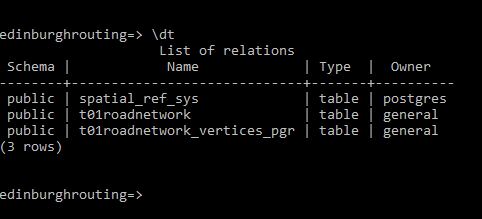
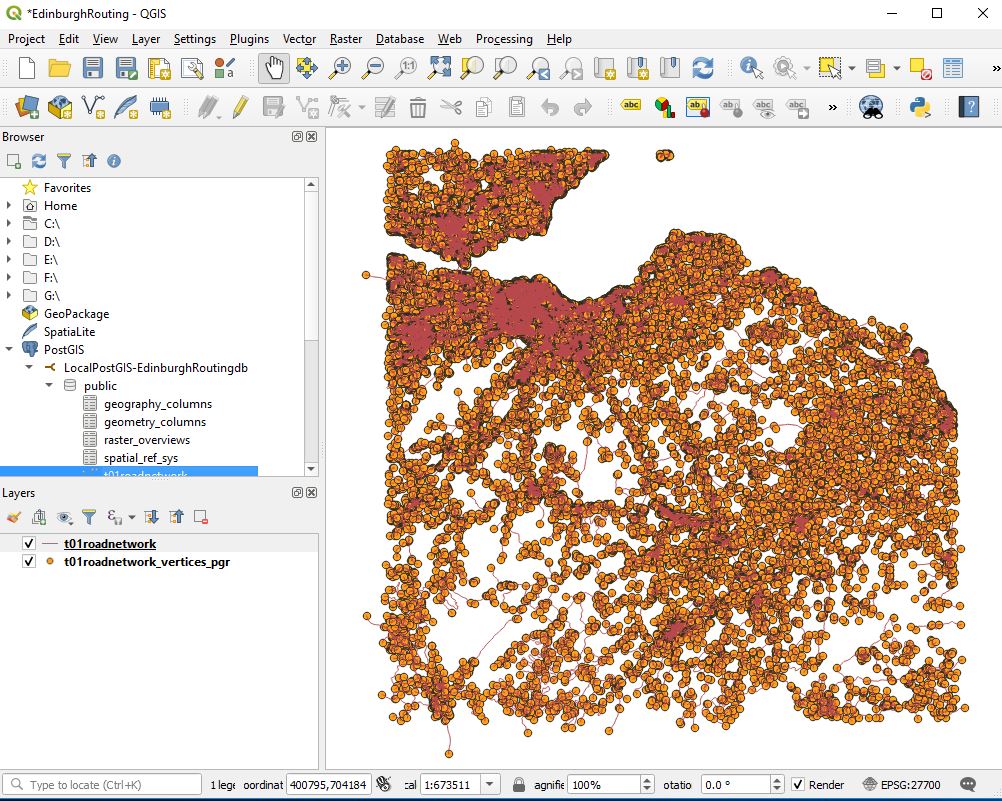
A new table has been added to the edinburghrouting database and next step is to display the network and its vertices. In QGIS.
In QGIS we should see something like
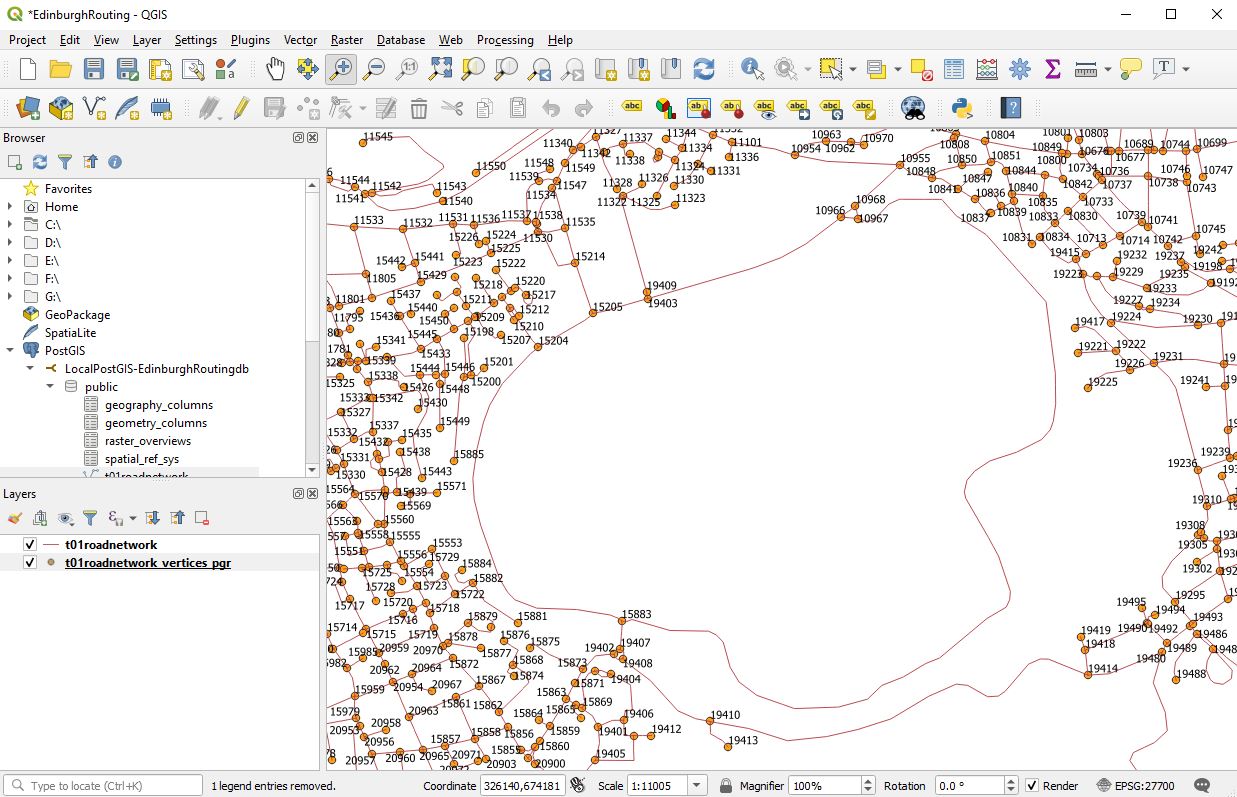
The next thing that I like to do is to label the nodes so that for quick identification.
And look to the t01roadnetwork table and see if the columns are clear and present.
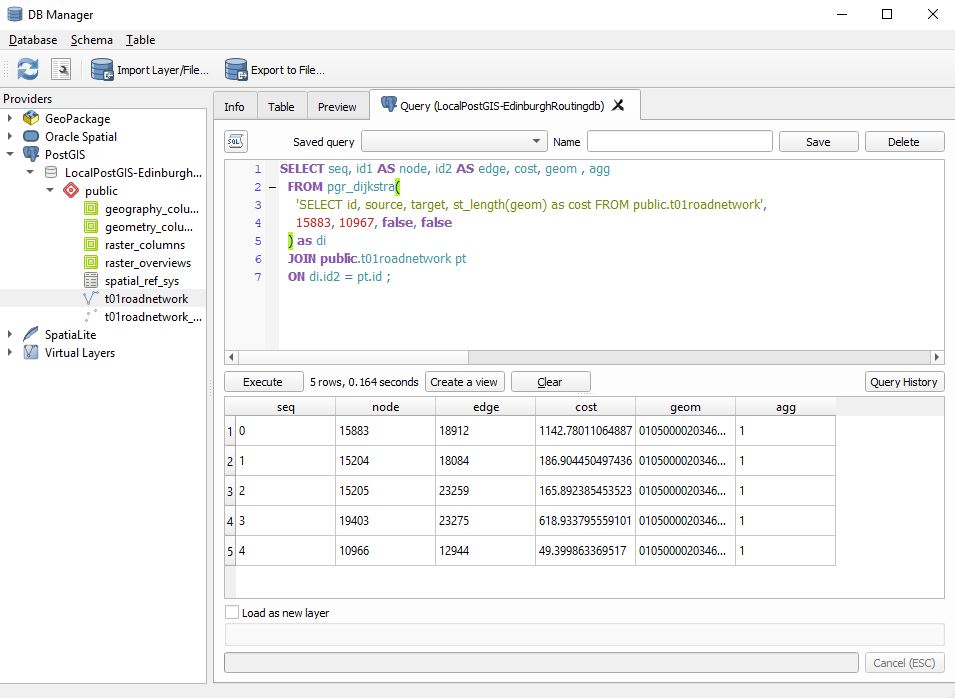
We are now ready to make a measurement. Here I choose the nodes 15883 and 10967
SELECT seq, id1 AS node, id2 AS edge, cost, geom , agg
  FROM pgr_dijkstra(
    'SELECT id, source, target, st_length(geom) as cost FROM public.t01roadnetwork',
    15883, 10967, false, false
  ) as di
  JOIN public.t01roadnetwork pt
  ON di.id2 = pt.id ;
Now we can load this as a new layer and then improve the symbology
Doing this we get.
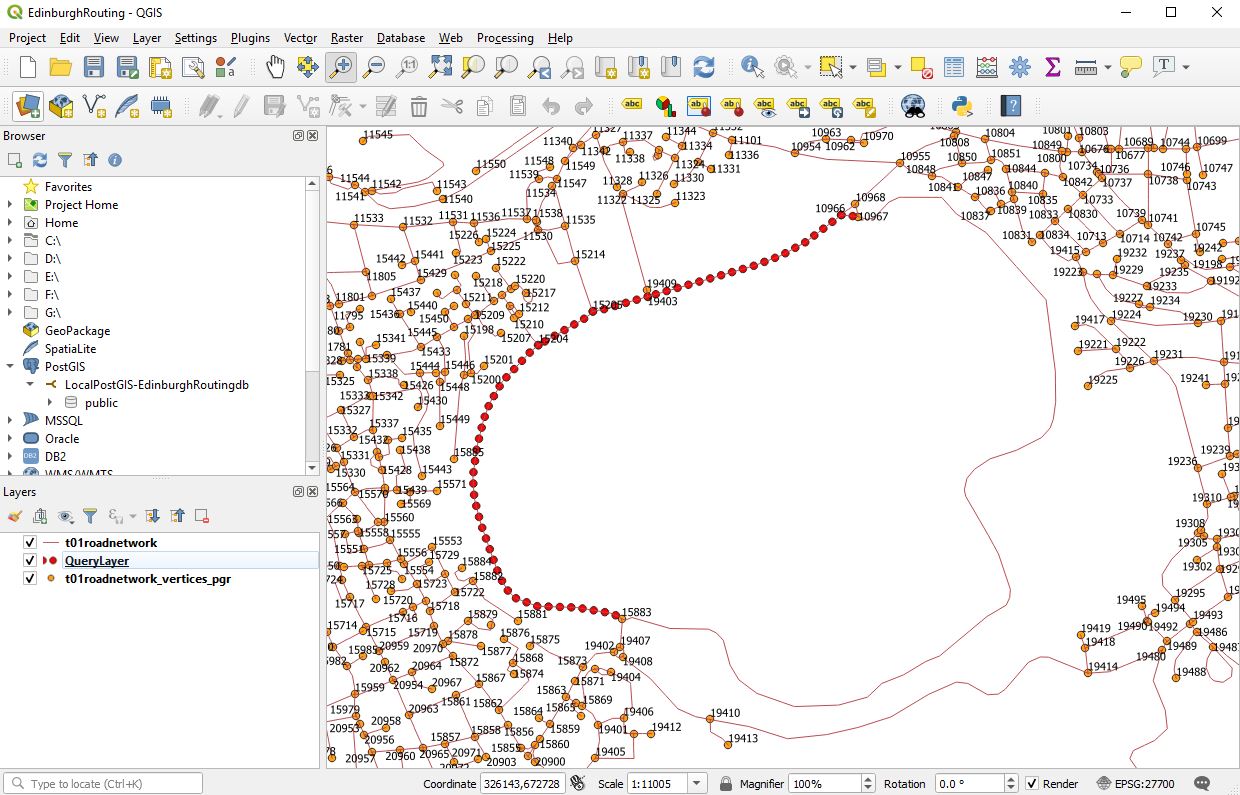
It should be noted that the line you see is a collection of lines. In my next post I will go through and indicate how we can amalgamate that into a single line for storage in a table.
Congratulations if you have got this far you should be able to measure the shortest distance between any two points on a valid network by altering the numbers.