GeoServer and ORACLE – WFS & WMS Config Tips

This post is a brief description of my findings on setting up Geoserver from scratch and some particular points on setting it up for an Oracle connection. I hope it will prove useful for others.

INSTALLATION
GeoServer with ORACLE database connection support
Geoserver Postgres (PostGIS) connection support comes with the default installation. This is NOT the case for Oracle or SQL Server therefore for enterprise purposes it is a requirement to install Geoserver WITH Oracle and SQL Server extensions if you wish to support these database connections.

I’ve done a post on Geoserver on windows installation link here that talks specifically about SQL Server. I will not go into a lot of detail about installation here. See below for links to the geoserver docker image I didn’t install the geoserver I describe here but I can confirm that we have been successful in including Oracle as a plugin to our Geoserver installation and we are able to connect.

Official Geoserver Docker Image GITHUB

Below is a recent (Feb 2024) list of Docker parameters available at install including Oracle and SQL Server please seek advice on the use of Docker for installation if you are not familiar with it already.

GENERAL SETUP

Contact Information – General Setup
On the Welcome screen there is a line that reads For more information visit {organization} to change this from the initial meaningless variable setting go to Contact Information and fill out your organisation.

Difference between Save and Apply – General point

In geoserver admin there are a lot of pages where there is a Save and an Apply button. Most users initially at least find this confusing.

In GeoServer, the terms “Save” and “Apply” serve different purposes:

Save:
When you click “Save”, it permanently stores the changes you’ve made to the configuration. These changes are saved in the GeoServer configuration files. , “Save” ensures that your modifications persist even after restarting GeoServer or rebooting the system. It’s like committing your changes to a version control system—it makes them permanent.
Apply:
“Apply”, on the other hand, is more immediate. When you click “Apply”, it takes the current configuration (including any unsaved changes) and applies it dynamically. The applied changes take effect immediately without requiring a restart or permanent storage. Think of it as a temporary adjustment that affects the running instance of GeoServer but doesn’t alter the saved configuration. In summary, “Save” makes changes permanent, while “Apply” applies them immediately without saving them to the configuration files

The first thing you will want to do is determine if you can actually connect to your ORACLE database.

ORACLE required parameters for database connection. Before you continue make sure you have the following

ORACLE host name
Port ORACLE database (default 1521)
database name
user – case sensitive
password – case sensitive
Geoserver installed with Oracle extension

It is good idea to get your DBA to setup a read only user if you are connecting to a database that is part of a vendor supplied product as you really should not be editing the database through anything except the vendor’s UI and Geoserver can be setup to allow edit of data. Geoserver has powerful security configuration included but conflicting settings can arise that may alter the intended security levels making it safer to enforce read only least privilege at the database level.

ORACLE and Postgres – some SQL Differences
Please be aware Oracle databases are by default case sensitive but may convert SQL Strings to upper case when passed to Oracle. I believe this complies strictly with the SQL Standard.

Postgres classifies tables, columns views and other database objects as Identifiers. SQL Identifiers must begin with a letter. If possible avoid including special characters in the naming of identifiers because although postgres may support them special characters are not allowed in the SQL Standard so their use might render applications less portable. Additional identifiers and keyword must begin with a letter. Keywords are defined as items such as SELECT / UPDATE / CREATE etc.. The SQL Standard says that databases should not define a key word that contains a digit or starts or ends with an underscore so identifiers could be something like t001users should be safe against possible conflict with future extensions of the standard. In postgres the maximum identifier length is 63 bytes. Additionally Postgres also folds unquoted names to lower case but some postgres management UIs allow for the naming of identifiers with varied case.

UPSHOT for Geoserver (and anything else for that matter)

If you are having difficulty referencing tables or views in any enterprise database – experiment with the case sensitivity in the query. There might be some folding of object names when passed to the server.
This characteristic should be born in mind when using SQL Views in Geoserver.

ORACLE Store setup to get the most out of Geoserver
Login to Geoserver admin panel using your admin account

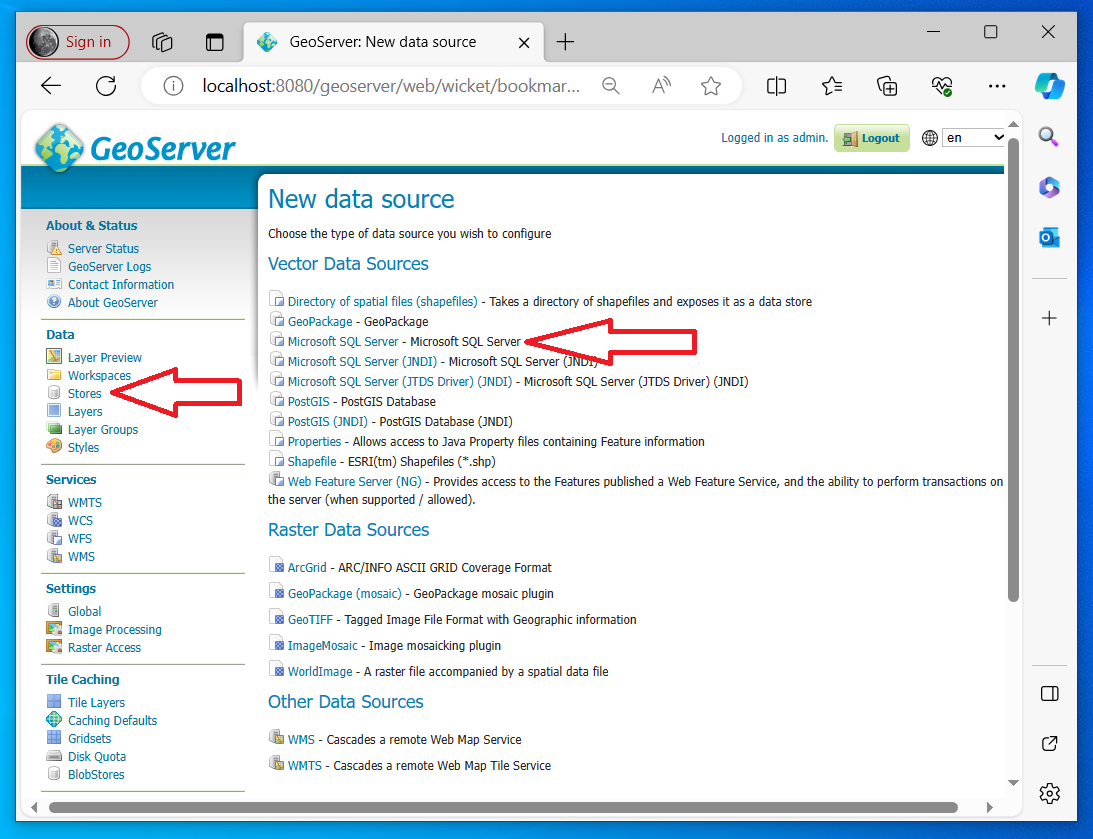
On the left hand side under Data hit Stores

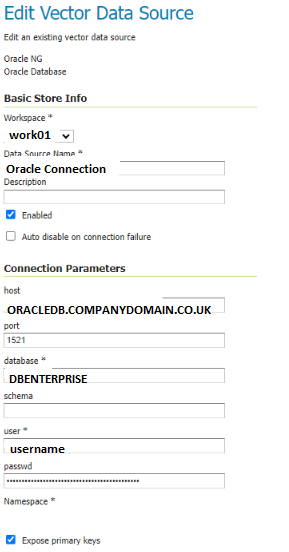
Assuming you have successfully installed Geoserver with the Oracle extension you should be presented with the following dialog and in particular the items highlighted below.

Oracle NG uses a standard Oracle driver (ignore the other options this article will not explain them)

Select Oracle NG

Use the default settings for most things but IMPORTANTLY ensure Expose Primary Keys is ticked

NOTE from our brief testing we found that exposing primary keys seemed to be one factor that improved stability in our Oracle connection when dealing with QGIS.

QGIS WFS set up to improve Oracle Connection Stability
It is recommended that you have a copy of QGIS to test setup to things like WFS

When we first started displaying specifically the Oracle spatially enabled table in QGIS via WFS service we found that the layer would initially display but if we were to leave the project and go back in for a period of time the layer would not be visible. This seemed to be temporary and after an unpredictable amount of time the layer would reappear. The attribute table continued to be viewable but polygons were not visible.

We fixed this by ensuring Expose Primary Key (see Geoserver layer configuration) was ticked and within QGIS within the WFS Connection Configuration ensure within the WFS options section that the version is set to match the linked WFS Service. This might not be necessary in all QGIS versions.

LAYER Config
Useful background information (partly written by co-pilot)

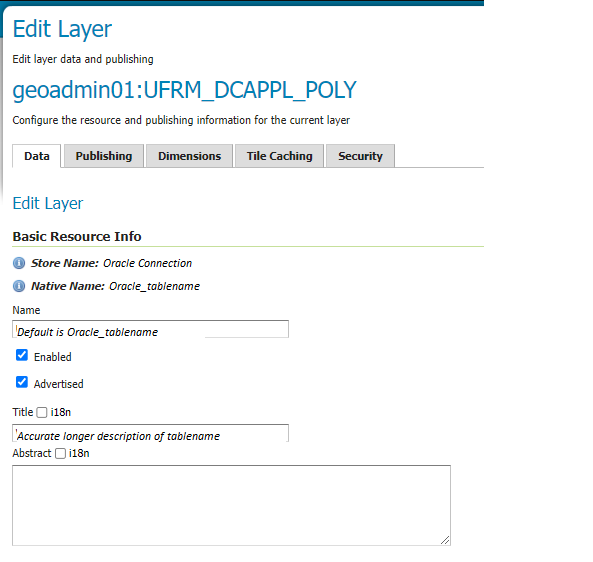
Enabled and Advertised parameters – Layer Config
In GeoServer, the Enabled and Advertised checkboxes play distinct roles in layer configuration:

Enabled:
When a layer is enabled, it means that the layer is available for requests (such as WMS GetMap or WMS GetFeature). If a layer is not enabled, it won’t be accessible for any kind of request. However, it will still appear in the configuration (and in the REST config). Essentially, enabling a layer makes it operational and ready to serve data.
Advertised:
By default, a layer is advertised. An advertised layer is included in the GetCapabilities request and appears in the layer preview. However, if you uncheck the Advertised checkbox, the layer will still be available for data access requests (like WMS), but it won’t appear in any capabilities documents or previews. In other words, non-advertised layers remain functional but are not explicitly listed in service metadata. Remember, enabling a layer makes it operational, while advertising it determines whether it appears in service capabilities and previews

Name and Title parameters – Layer Config
Name:
The Name corresponds to the identifier used to reference the layer in WMS (Web Map Service) requests. It is primarily used for computer interaction and serves as an internal reference default name is usually the name of the table or the name of the referenced view. When creating a new layer for an already-published resource, the Name must be unique to avoid conflicts. Essentially, it’s the technical name associated with the layer.
Title:
The Title provides a human-readable description that briefly identifies the layer to clients. Unlike the Name, which is for computers, the Title is meant for humans to read. It helps users understand the purpose or content of the layer. For example, if you have a layer representing a map of the USA, you might set the Title to “This is a map of USA.” Remember, while the Name is essential for system functionality, the Title enhances user experience by providing meaningful context about the layer1

Security – the Name does not need to be the table or view name you are referencing. This string appears in the URL which may be viewable to the user – you may wish to obfuscate this by changing the name

i18n – Internalization – Layer Config
Internationalization (i18n):
GeoServer supports returning a GetCapabilities document (used for describing available services and layers) in various languages. The i18n functionality is available for the following services:
WMS 1.1 and 1.3
WFS 2.0
WCS 2.0
The i18n editor allows you to provide translations for the title and abstract of various components:
Layers configuration page
Layergroups configuration page
WMS, WFS, and WCS service configuration pages
Additionally, for Styles, there’s a separate i18n configuration (see i18N in SLD).By default, the i18n editor is disabled and can be enabled via the i18n checkbox.

GetCapabilities Document Language:
The language of the GetCapabilities document can be selected using the AcceptLanguages request parameter.GeoServer’s response varies based on the following rules:
Internationalized elements include titles, abstracts, and keywords.If a single language code is specified (e.g., AcceptLanguages=en), GeoServer tries to return content in that language.If multiple language codes are specified (e.g., AcceptLanguages=en,fr), GeoServer attempts to return content in one of the specified languages.

Coordinate Reference Systems – Declared SRS and SRS handling – Layer Config

If you are in the UK ensure that Declared SRS is set to 27700

SRS Handling
In GeoServer, the SRS handling setting plays a crucial role in how coordinate reference systems (CRS) are managed. Let’s explore its significance:

Declared SRS:
The Declared SRS specifies the coordinate system that GeoServer publishes to clients. It represents the CRS that clients should use when interacting with the layer. Essentially, it’s the officially declared CRS associated with the layer.
SRS Handling:
The SRS Handling option determines how GeoServer should handle projection transformations when the declared CRS and the native CRS of the data differ. Here are the possible values for SRS Handling:
Force declared (default): In this mode, GeoServer forces the declared SRS upon the data, overwriting the native CRS if necessary.
Other options (not mentioned in the snippet):
Reproject native to declared: GeoServer performs a reprojection from the native CRS to the declared CRS.
Reproject declared to native: GeoServer reprojects from the declared CRS to the native CRS.
None: No reprojection is performed; the data remains in its native CRS.
In summary, the SRS handling setting ensures that data is presented consistently to clients, regardless of the underlying native CRS. It’s a critical aspect of maintaining accurate spatial information in GeoServer1.

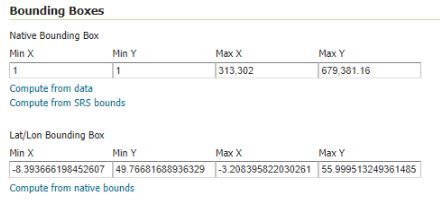
Bounding Box recommendations – Layer Config
Scotland

Min X = 010000
Min Y = 533000

Max X = 464000
Max Y = 1215000

West Lothian

Min X = 287000
Min Y = 655000

Max X = 314000
Max Y = 678000

UK

Workspace setup and visibility in WFS
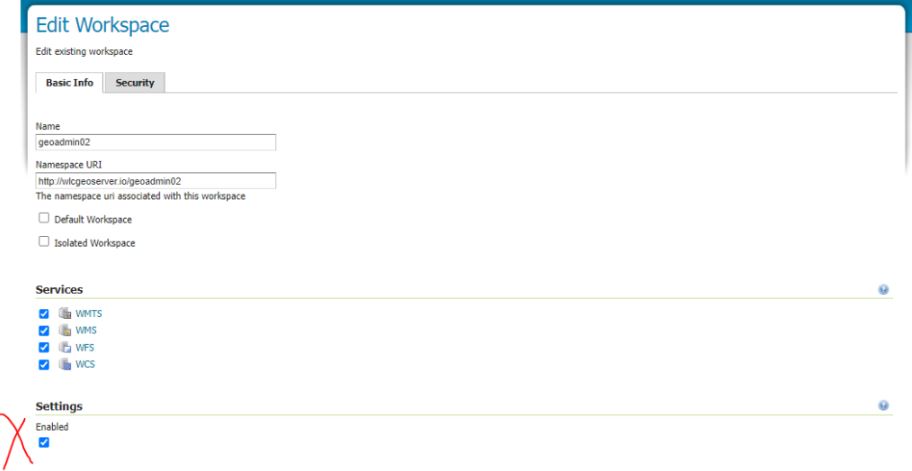
Workspaces can allow for editing and not editing of information although to date I seem to be struggling to isolate layers and workspaces to allow them to be edited or not edited. One thing that is important in our present system is to Enable the settings in the Basic info – without this the layers within the workspace were not showing up in the WFS

Restrictions on Layers : Important Note

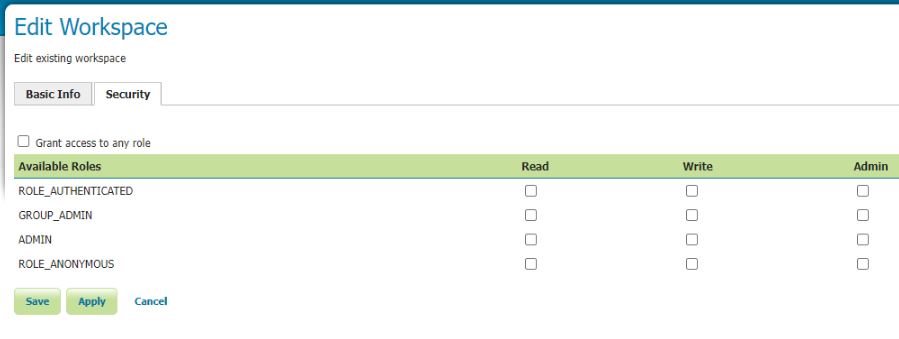
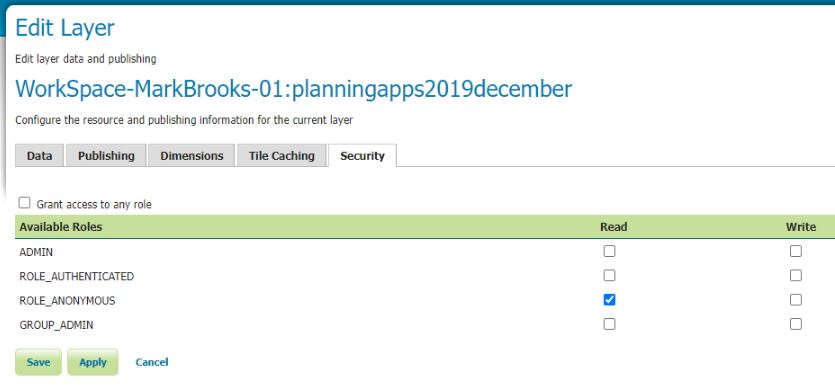
Important – Workspace Security settings override Layer Security Settings

If you need to have different layer security settings within one Workspace you will need to turn off all Workspace security settings e.g see below.

Geoserver Installation (Configuration for SQL Server on Windows)

Once you have your data in an Enterprise Grade database sharing that information becomes important. Some vendors, in particular Digital mapping SAAS vendors want you to transfer your data into their clouds but for a lot of authorities that is categorically impossible for large segments of their data. For example about 3/4 of UK planning authorities run on software built by a company called IDOX Group plc which holds its data in Oracle this cannot be moved. For Geographical data here’s where Geoserver comes in.

Geoserver Official Website

From the website
GeoServer is an open source server for sharing geospatial data.
Designed for interoperability, it publishes data from any major spatial data source using open standards.

GeoServer implements industry standard OGC protocols such as Web Feature Service (WFS), Web Map Service (WMS), and Web Coverage Service (WCS). Additional formats and publication options are available as extensions including Web Processing Service (WPS), and Web Map Tile Service (WMTS).

Another way of putting it Geoserver allows programs that display and manipulate geographic information to display and edit that data while keeping it safe and secure and located in enterprise databases. It can connect to SQL Server / Postgresql and I am told Oracle which are the main relational databases used by Local authorities today so once setup and configured it could be used to compare and contrast information in one location from variable datastores. Datastores that for historical reasons cannot be moved. Here I concentrate on SQL Server because we have a particular issue with new systems needing to connect to SQL Server but it would be great if we could get it working with Oracle as well.

The following are my notes on installation and configuration of Geoserver on Windows linking to SQL Server and in this case a remote(not on the same computer) SQL Azure instance I believe any remote SQL Server instance would be similar. This post is a detailed explanation of the installation of Geoserver locally on a laptop but I believe installation would be exactly the same on a Windows Server machine albeit additional steps would be required to publish to the web either internally or externally.

Its all configuration so remember your host names / IP numbers / ports / usernames / passwords / database, table and column names

To start this tutorial please ensure the following resources are available;

  • SSMS – installation of Sql Server Management Studio
  • SQL Azure instance with privileges to run SQL. Please note you will need to know the port number of your SQL server instance and have a Username and Password for your user.
  • Necessary privileges to set the firewall on the database which you will link to Geoserver –
  • QGIS – installation – If you don’t have a SQL Server instance with geodatabase already that you can use you will probably need this to add at least one record to a geometry enabled table I plan to expand my notes on this but at present you might be able to skip this
  • Geoserver 2.24.1 – installation files
  • Enough privileges on the computer you are installing geoserver to download installation files and move files into a library subdirectory of the c:/program file/geoserver directory
  • WorkFlow Synopsis Overview
    1)Download and install Java runtime engine (as above importantly here I use 11)
    2)Download and install Geoserver (2.24.1 in this case)
    3)Test that the Geoserver Admin dashboard is up and working
    4)Download and configure Geoserver Extension for SQL Server library (SQL Azure example)
    5)Good idea to setup a login specifically to your SQL Azure instance with least privilege – Your SQL Server instance with geodatabases may already have suitable logins. So steps 5 and 6 can be skipped
    6)Good idea to create an example table with Geodatabase in SQL Azure – will be used as a test connection table – NOTE if you already have a SQL Server with geodatabases you could use that instead.
    7)White list IP within the SQL Azure instance firewall rules to Geoserver computer
    8)Opening Geoserver and setting the ‘Store’ to reference your SQL Azure database using the login setup in step 5.
    9)Adding a new layer from the Store made in point 8 and seeing if you can Preview the layer – Ideally you should have a table that has some features in it. Setting the WMS and WFS up in Geoserver with sufficient rights to allow editing (if WFS setup)
    10)I don’t explain it in my post below but the next step would be to test in QGIS to see if you can setup a project in QGIS which can pull from Geoserver against a basemap and you check that the Polygons are actually where you want them to be.

    Workflow Detailed
    1)Download the install Java Runtime via JDK

    There are some complications here
    Initially I tried to use the Java Runtime engine 17 and went through the complete Geoserver installation but on testing I was getting a Java error when trying to view layers. After a short google I came across a stack overflow thread that indicated that geoserver support for JDE 17 was experimental and I should use Java Runtime engine 11. Deinstallation of 17 and installation of 11 solved this.

    Additionally there is the issue of where you obtain the Java Runtime installation from – there is the Adoptium location and then there is Oracle location. Oracle are making moves to charge for use of their Java Runtime engine so it is important that you use Adoptium resource to reduce costs.

    Later I will list the url to the JDK download for Java Runtime engine but it is important to realise that Adoptium is a safe source, well supported and noted as open source.

    https://adoptium.net/en-GB/members/

    so

    Google Search for Adoptium
    https://adoptium.net/en-GB/

    Navigate to other platforms and versions and target windows 64 bit JDK and 11 LTS version and download the .msi.

    After a short delay you will be shown the msi which will be in your downloads folder

    Double click on it to install.

    Now the only thing that is tricky here is to setup the java home directory as follows

    Video Installing Adoptium JDK on Windows

    In particular note this section

    2) Download and install Geoserver

    Go to the official Geoserver web page and follow the links to download the windows installer

    Here I use the windows version of Geoserver version 2.41.1 obtained January 2024 from the following url
    Geoserver Official Website

    See download button and then go to Windows Installer

    I chose the left option and then I chose the Windows Installer option

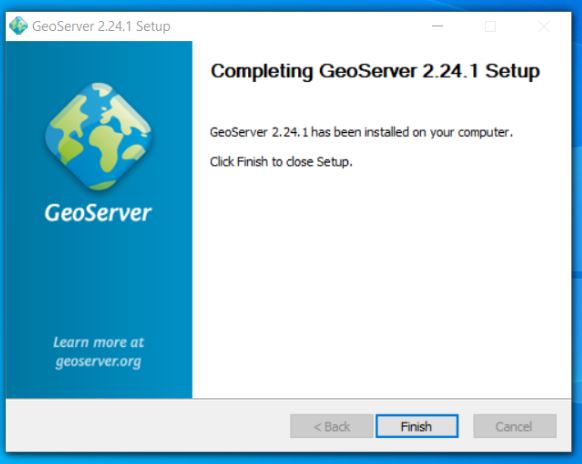
    This will download Geoserver-2.24.1-winsetup.exe to your download directory and you can then start the geoserver installation process

    Next open up the executable and follow the instructions

    Next agree the licence

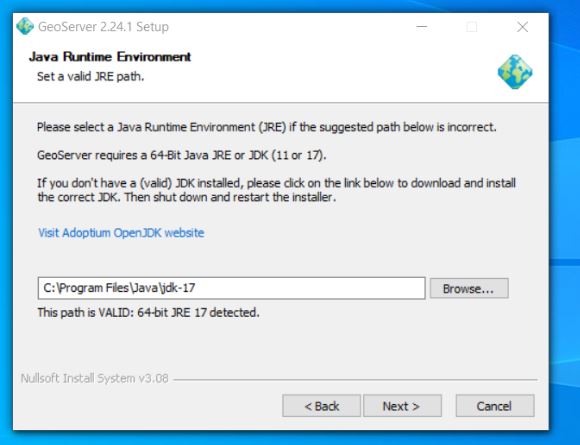
    Next we reference the java library installed in the previous step – if you have set the java_home variable correctly it should automatically find JRE 11 for you and it will place it within the path reference below. I don’t have a screenshot of the JRE 11 reference here as on my first installation I referenced the Oracle 17 JRE – (note I went back de-installed geoserver installed JRE 11 and then reinstalled geoserver to counter the proprietary Oracle runtime library and importantly to fix the issue that I was facing of geoserver not being compatible with JRE 17
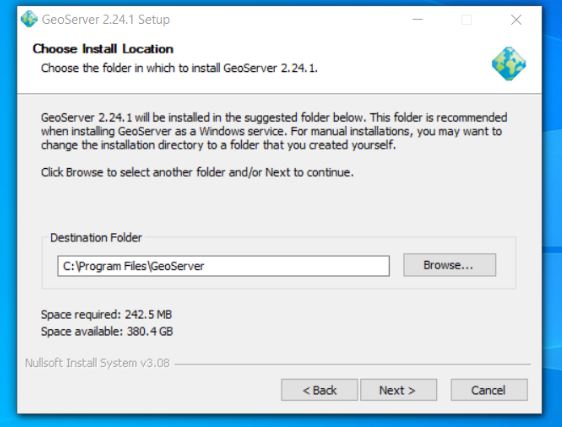
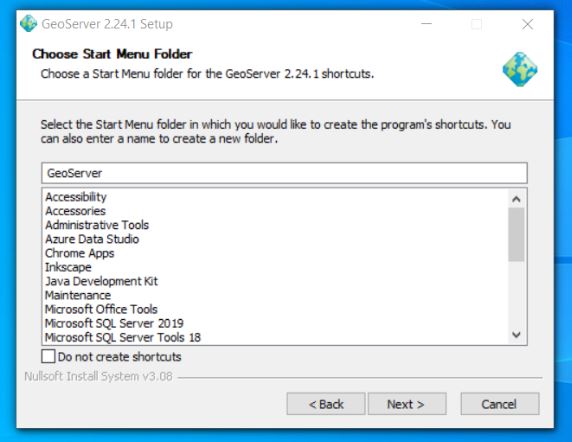
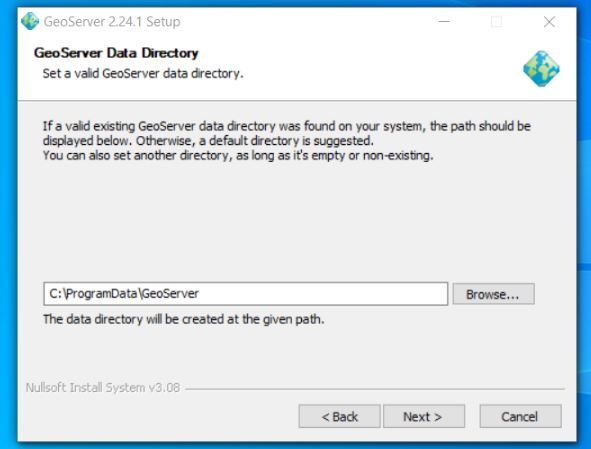
    The rest of the install from here is standard for a windows install

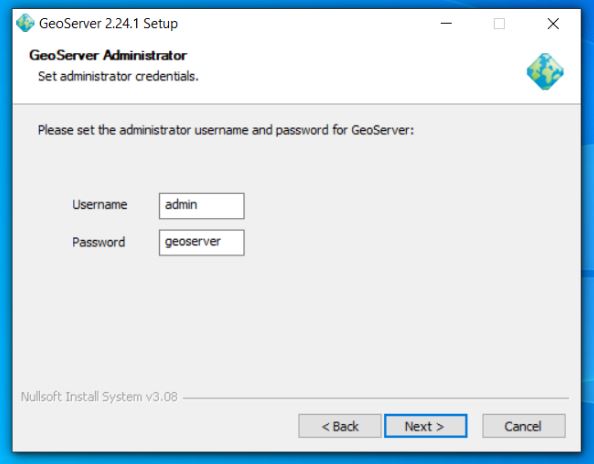
    Next setup the default admin password – defaults are admin / geoserver

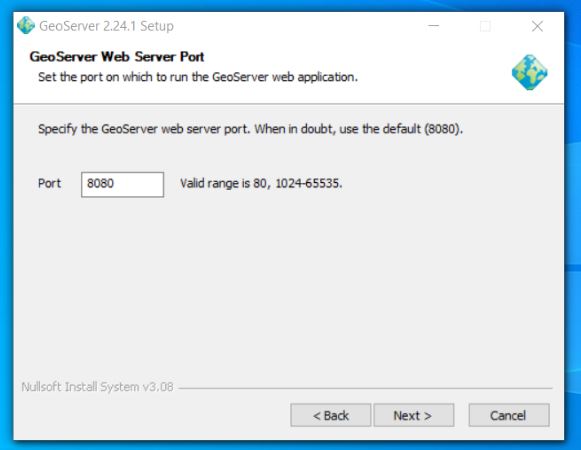
    Set up port geoserver runs on – default is 8080

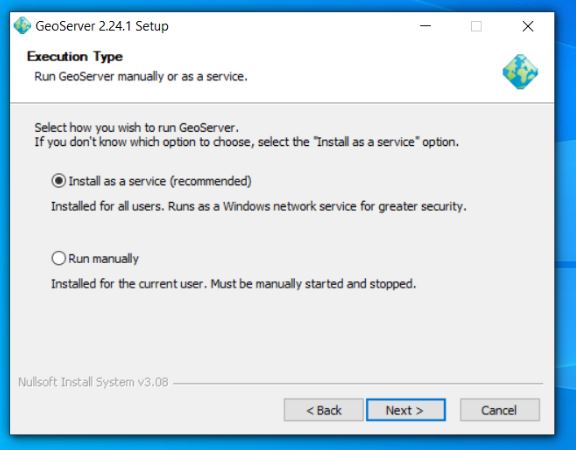
    Next choose the execution type I like to install geoserver as a service

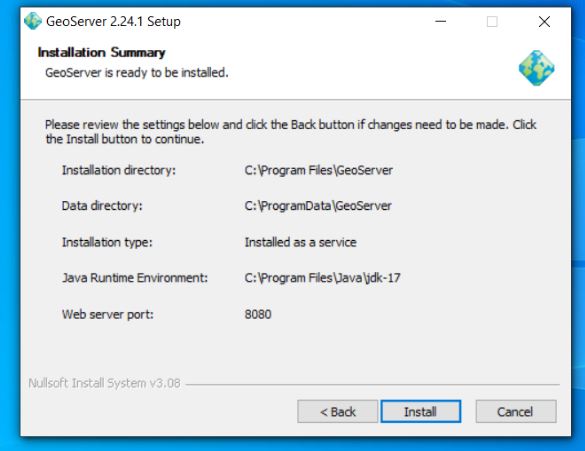
    Confirm your preferences and then trigger install

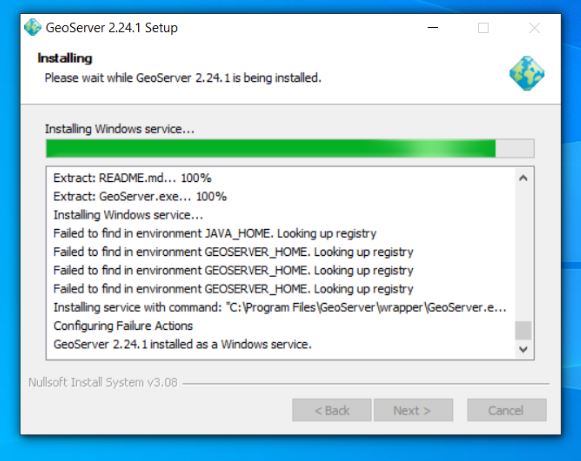
    Now you should see geoserver on your local machine as a service which you will need to ensure is running to access properly

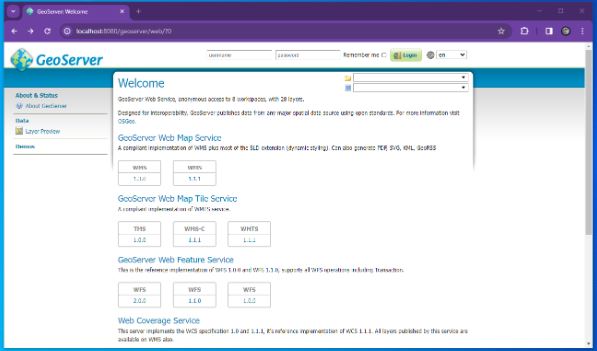
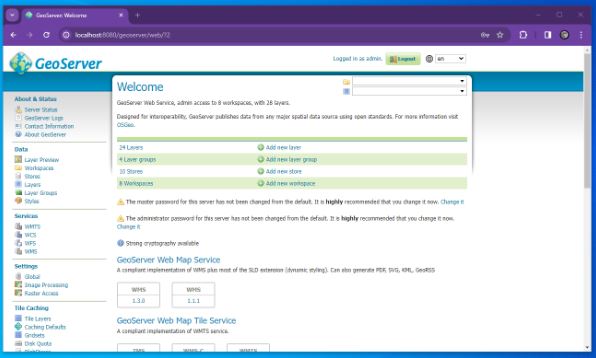
    3) Test that Geoserver Admin dashboard is up and working at least locally

    If you have used the same settings as me open a browser and navigate to the following url

    https://localhost:8080/geoserver/web

    Login with the username and password which is usually admin / geoserver

    At which point you should see something similar to the following

    4) Download and configure Geoserver Extension for SQL Server

    At install Geoserver comes with the ability to connect to Postgres but NOT SQL Server so we must install/configure plugin extension to enable Geoserver SQL Server connections.

    Here we go back to the geoserver.org website and go to download but this time instead of choosing the windows installer we look to the Extensions section and choose SQL Server

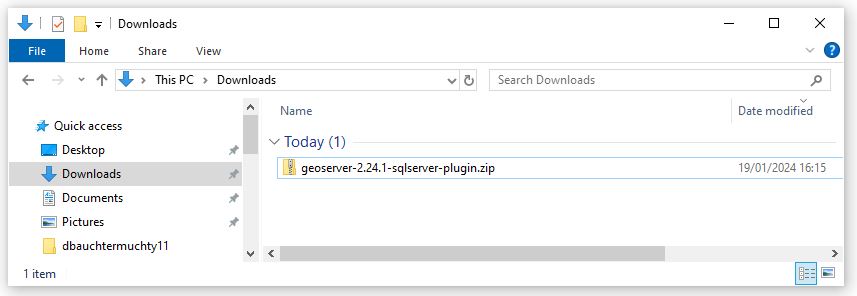
    This should download geoserver-sqlserver extension plugin

    Next copy all files with the jar suffix into the following directory

    C/program files/GeoServer/webapps/geoserver/WEb-Inf/Lib

    Next restart the geoserver and go back to the local host and sign in

    http://localhost:8080/geoserver/web/?0

    We are now very close to linking to SQL Server prior to that we must whitelist our geoserver so that your SQL Server instances will accept connections from your geoserver. Steps 5 and 6 are more about creating a user and ensuring you have a geodatabase with a georeferenced table skip to 7 if you want to read about white listing in SQL Azure or you have an alternative database that you could use with requirements already set up.

    5) Next its a good idea to create a user with least privilege this will be used to set up the link so go to SSMS

    Least privilege User Login Setup SQL Server

    Here allow the amount of access you wish users to have remembering the principles of least privilege

    6) Lets create an example table with geometry that we will be connecting
    When I first tried connecting to SQL Server (SQL Azure in my case) I didn’t have any georeferenced tables so I created one and added a few records. If you have a database already with tables with geometry or geography you might not need to do this step.

    So open SSMS and navigate to your database and use the following TSQL to create a table here I call it t064

    SET ANSI_NULLS ON
    GO
    
    SET QUOTED_IDENTIFIER ON
    GO
    
    CREATE TABLE [dbo].[t064](
    [PKID] [int] IDENTITY(1,1) NOT NULL,
    [geomcol] [geometry] NULL,
    [sitename] [varchar](30) NULL,
    PRIMARY KEY CLUSTERED
    (
    [PKID] ASC
    )WITH (STATISTICS_NORECOMPUTE = OFF, IGNORE_DUP_KEY = OFF, OPTIMIZE_FOR_SEQUENTIAL_KEY = OFF) ON [PRIMARY]
    ) ON [PRIMARY] TEXTIMAGE_ON [PRIMARY]
    GO

    This is a really simple table with three columns and you might want to link to it through QGIS and just create a few records – I would try and use a default projection of 27700 if you are UK based. I might come back with an example table with records..

    If you want to link to this table for testing then you should try and input at least one record here. I added records using QGIS and I hope to come back to this post and update it to be more specific

    7) White List the IP within your SQL Server or SQL Azure instance.
    Setting IP White List in SQL Azure

    8) Opening Geoserver and setting the ‘Store’ to reference your SQL Azure database using the login setup in step 5

    Navigate to the local host url for Geoserver namely

    http://localhost:8080/geoserver/web/?0

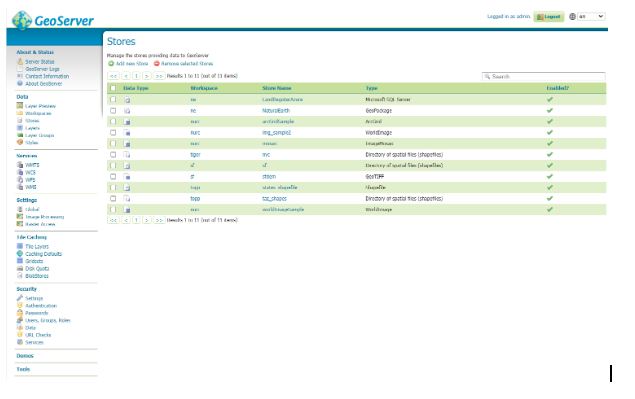
    Go to store and then you should see the following page

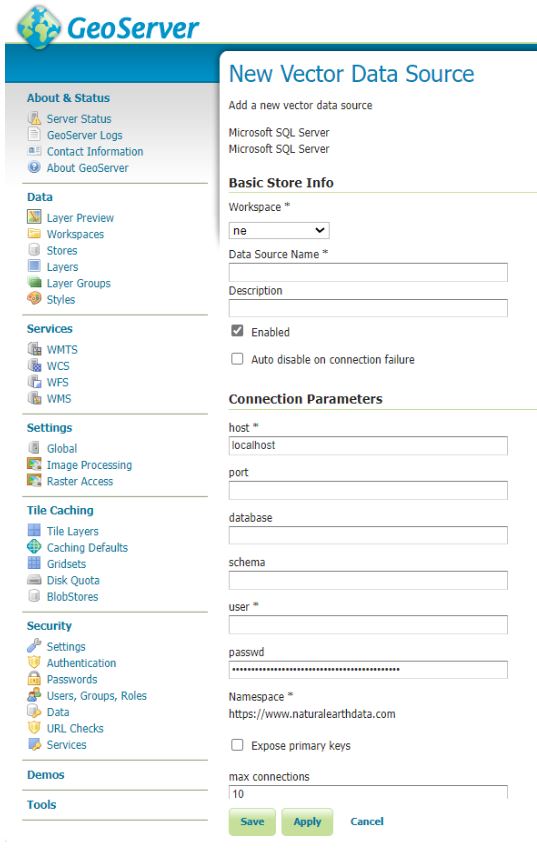
    Hit the Add New Store green plus button in the top left corner you will be presented with the following screen

    Fill out as many details as you can

    For SQL Azure this is likely to be similar to the following

    Host = namevariable.database.windows.net (normally unique to instance in SQL Azure)
    Port = 1433 (sql azure default)
    Schema = dbo (sql azure default is dbo but your database maybe bespoke)
    User = uservariable (remember least privilege is a good idea)
    Passwd = passwordvariable (should be unique to your database)
    

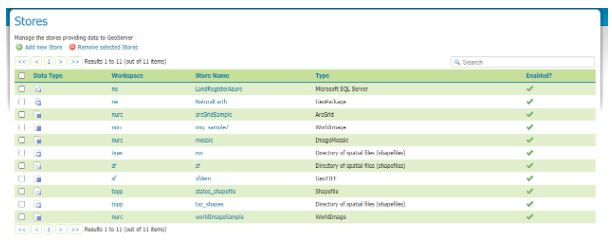
    Save and Apply and then your new connection should appear in your store

    Here’s an example…. (see top line)

    For the purposes of this tutorial I setup a login with db_owner rights to the database LandRegisterAzure your mileage will vary.

    9) Next we add the layer which references the SQL Server

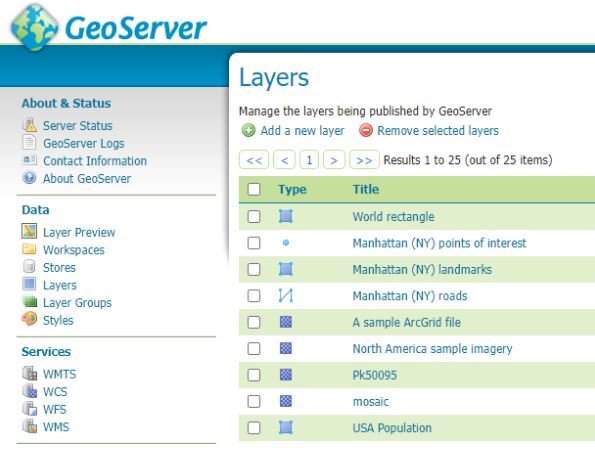
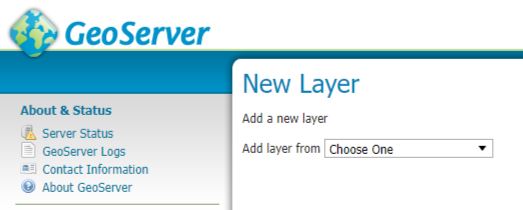
    Select Layers within the Data section of the menu (usually to the left of the geoserver dashboard) then hit Add a new layer

    You should get the following windows

    From the drop down select the store which references your SQL server. This will reveal all the tables and views in the database and you scroll through them to the table or view you wish to publish and in the column marked Action will be publish you can hit the Publish highlighted text (I’ve done that here already so under Action our table is marked as Publish again and there is a tick in the column titled Published.

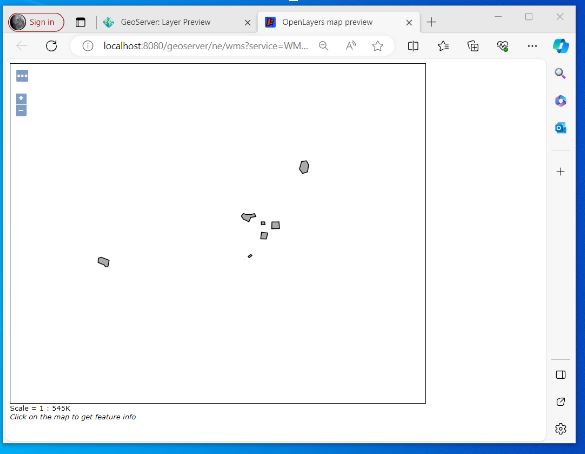
    We can now quickly test to see if things look like they are working by going to Layer Preview.

    Look to the left hand side and select Layer Preview

    Scroll down through the list and identify the layer that you have just added. I now select the open layers option

    A new browser tab will open and if you have successfully configured the SQL Server you should be presented with your layer – without any background

    10) I don’t go into it here but next I will try and write up my notes on QGIS and Geoserver setup – On my laptop I managed to set up a WFS to my SQL Azure instance through Geoserver where the layer was added to a project and I was able to edit information in my SQL Azure database through QGIS and were displayed correctly against a basemap in the right place!!

    –/END/–

    SQL Server Express – Connection to QGIS issues with geometry display

    I was having issues displaying polygons stored in SQL Server Express locally within a QGIS 3.28 project.

    After having quizzed unsuccessfully GPT 4.0 I found the answer on good old Stack Overflow.
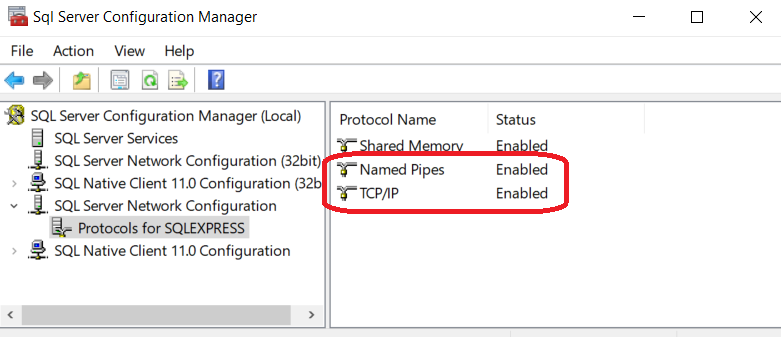
    As part of your SQL Server Express installation you should have installed SQL Server Configuration Manager. Open this administration package and navigate to your instance to show the following;

    Make sure both Named Pipes and TCP/IP are enabled.

    That fixed it for me
    Important note the host connection string IS case sensitive and sometimes when you use the properties from within SSMS to look at the hostname it capitalise things so watch out! That caught me out for half an hour!!

    And here is my definition of the geometry table

    CREATE TABLE [dbo].[geometry_columns](
    [pkid] [int] IDENTITY(1,1) NOT NULL,
    [f_table_catalog] [varchar](50) NULL,
    [f_table_schema] [varchar](50) NULL,
    [f_table_name] [varchar](100) NULL,
    [f_geometry_column] [varchar](50) NULL,
    [coord_dimension] [int] NULL,
    [srid] [int] NULL,
    [geometry_type] [varchar](50) NULL,
    PRIMARY KEY CLUSTERED
    (
    [pkid] ASC
    )WITH (PAD_INDEX = OFF, STATISTICS_NORECOMPUTE = OFF, IGNORE_DUP_KEY = OFF, ALLOW_ROW_LOCKS = ON, ALLOW_PAGE_LOCKS = ON, OPTIMIZE_FOR_SEQUENTIAL_KEY = OFF) ON [PRIMARY]
    ) ON [PRIMARY]
    GO

    Geoserver – Setting up Users / Roles / Workspaces and Layers

    Create Users
    Firstly ensure you are logged in as administrator ONLY the system administrator can set up users and roles and the default geoserver username/password of the administrator is admin/geoserver

    The sa login has additional menus as here

    Go to the Security menu on left towards the bottom and find line marked – Users/Groups/Roles

    Go to the Roles tab

    Look to the green circle with white cross and add new role and complete as appropriate

    Note once you have created the role you will not be able to edit the name of that role so you have to delete the role and then create a role with a different name if you don’t want the old role name to continue.

    Next we create the users

    Go to the Users/Groups tab

    Look to the green circle with white cross and add new user and within the Roles taken section ensure you move the role you created from the left box to the right see grey above.

    The new username should now appear in the User list

    You grant admin privileges to the workspaces through the Workspace section as follows

    Within the edit workspace section go to security

    And give admin rights to the role you wish to link to the workspace

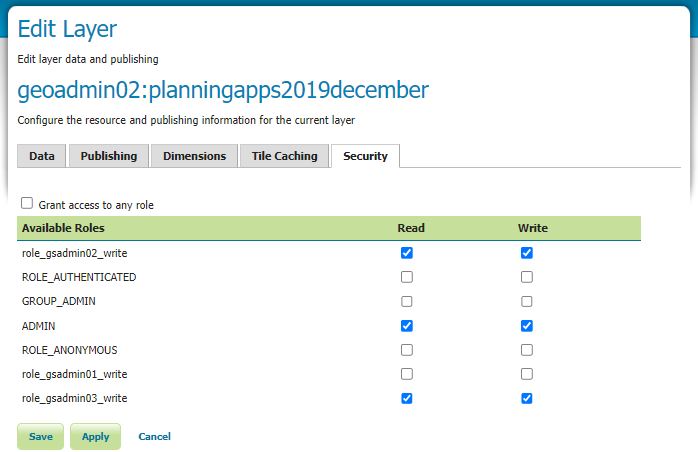
    Note that you still won’t see anything until you go into layer edit and edit the security as follows.

    Within the Security section you can also see the roles added

    Add POSTGIS extension to Azure Postgres Database – Worked Example

    Firstly we need to allow for the extension on the server.
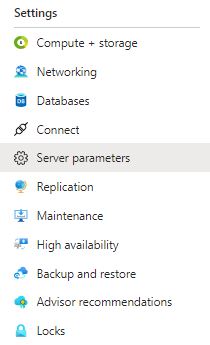
    Within the Azure portal navigate to server parameters

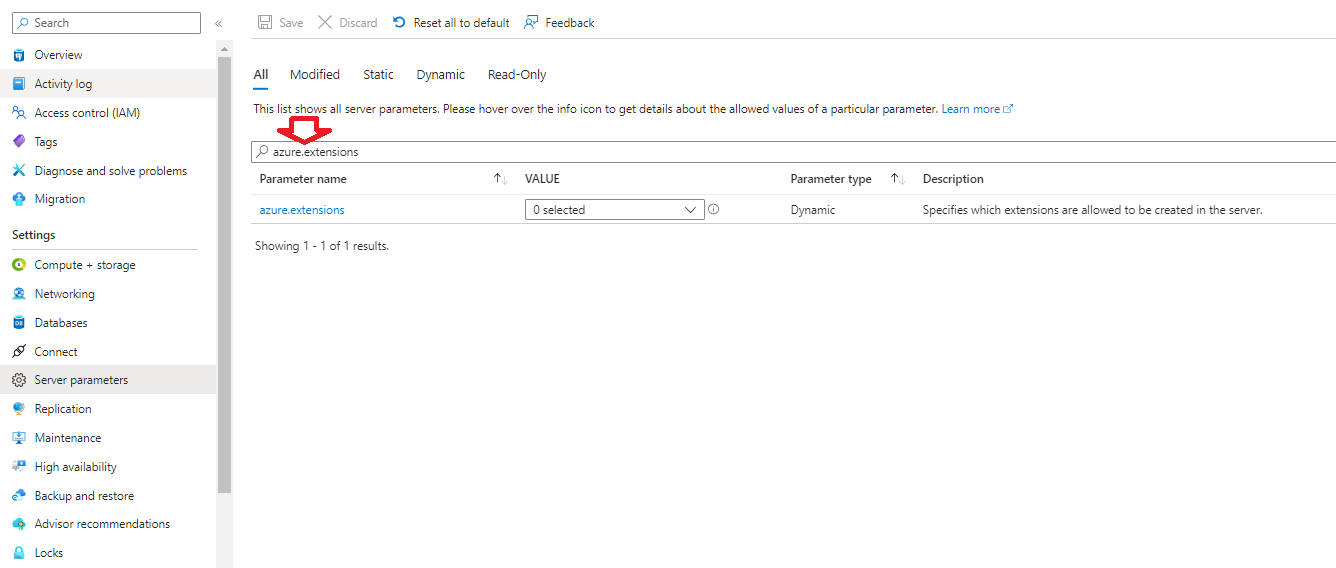
    Search for azure.extensions

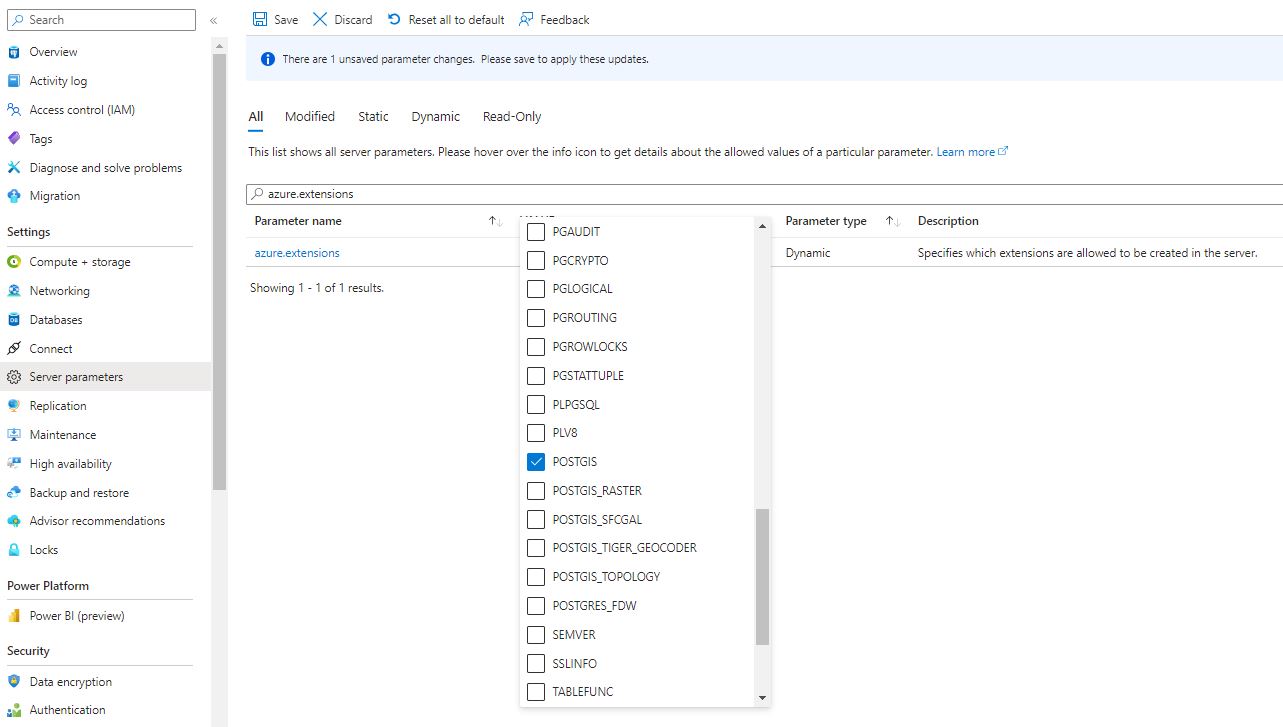
    Select which extensions to add
    REMEMBER to save before exit!

    Wait a short period while the extension is loaded onto the server..

    Some points
    Azure Database for PostgreSQL supports a subset of key PostgreSQL extensions as listed HERE. This information is also available by running SHOW azure.extensions;. Extensions not listed in this document aren’t supported on Azure Database for PostgreSQL – Flexible Server. You can’t create or load your own extension in Azure Database for PostgreSQL.

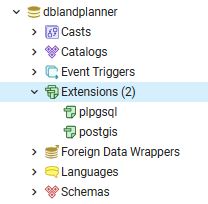
    After extensions are allow-listed and loaded, these must be installed in your database before you can use them. To install a particular extension, you should run the CREATE EXTENSION command. This command loads the packaged objects into your database.

    The extension(s) should now be listed against your database.

    QGIS – Working with Free BASEMAP Services for Desktop Projects (Bing and Google Maps Aerial and Lines)

    As soon as you need to practically implement any information in Spatial Databases display of the information through a mapping front end becomes absolutely vital. Many database administrators are used to simply going into their favourite database editors and displaying the raw subsets of tables and queries. That works well for financial transactions and inventory tables were collapsing the attributes of objects into single digits is often valuable or possibly preferable to simple photos. When dealing with boundary information the complete opposite applies. Display of information as simple screens of matrix numbers is completely useless.

    Additionally often boundaries make zero sense unless referenced to the land beneath them either through aerial photography or topographic maps.

    In a previous time where I worked we actually commissioned a company to give us aerial photos of a local authority. This was not an insignificant amount of money and was probably only marginally reduced by the vendor having multiple channels of sale. Google and Microsoft are now very good in offering very good aerial and line interpretations for limited use to companies and individuals. This is absolutely great as it can be used as background either to confirm accuracy of other information or as data upon which to calculate further information (eg routing).

    So how can an individual get up and started with some of these basemaps.

    Sometime recently (I know not when exactly) QGIS changed its implementation of Open Street Maps through their desktop – rather than being an additional plugin Open Street Map provision is now included on install.

    Here I am working with QGIS version 3.10

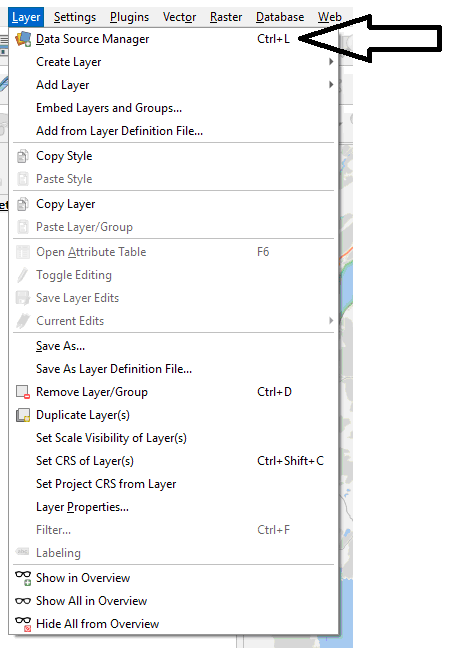
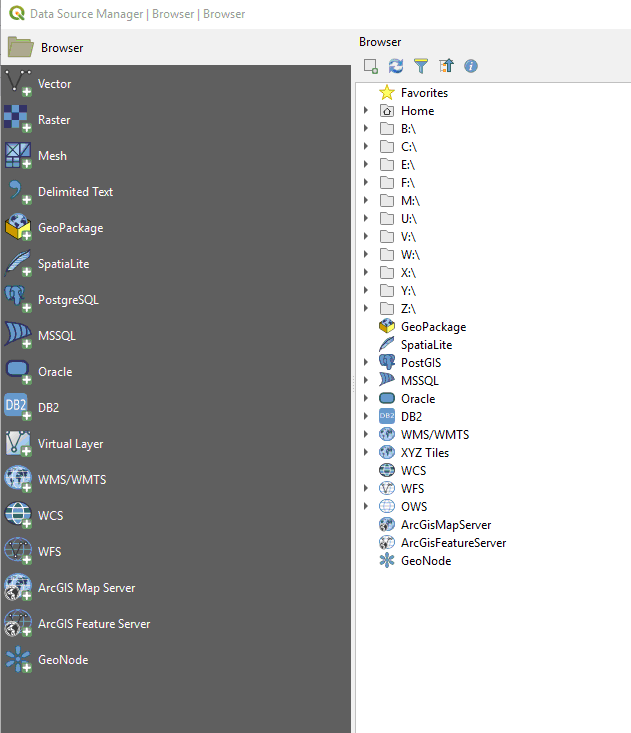
    Now you should be presented with the Data Source Manager Dialog which looks like this

    Now expand the XYZ Tiles

    You can then double click on any one of the three and the WMS will be transferred into the layer panel

    Layer > Data Source Manager > XYZ

    Thank you to Google and Microsoft and OSM and QGIS for a great implementation.

    SQL Server Express – starting to work with Geometry Functions in SQL Server

    Firstly I created a database.

    This is essentially me trying to implement in SQL Server what I had written about in Postgres here – Using ST_Within in Postgres

    Now I create the starting tables.

    CREATE TABLE [dbo].[t00001fields](
    	[pkid] [int] IDENTITY(1,1) NOT NULL,
    	[fieldname] [varchar](50) NULL,
    	[geom] [geometry] NULL
    

    Then

    CREATE TABLE [dbo].[t00002plots](
    	[pkid] [int] IDENTITY(1,1) NOT NULL,
    	[plotname] [varchar](50) NULL,
    	[geom] [geometry] NULL
    

    Now a magic junction table that will identify what plot is within which field when it is run

    CREATE VIEW v001FieldPlotJunction AS
    SELECT t00002plots.pkid as Plotspkid,t00001fields.pkid as Fieldspkid
    FROM
    t00002plots,
    t00001fields
    WHERE
    t00002plots.GEOM.STWithin(t00001fields.GEOM) = 1;
    

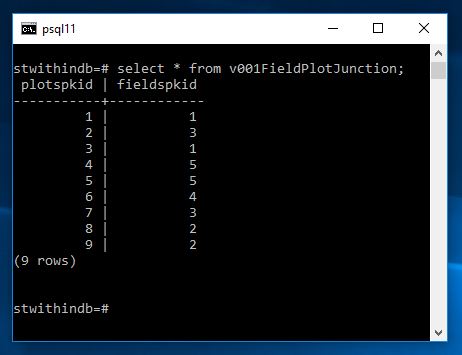
    and here’s an example of it running on local in SQL Express

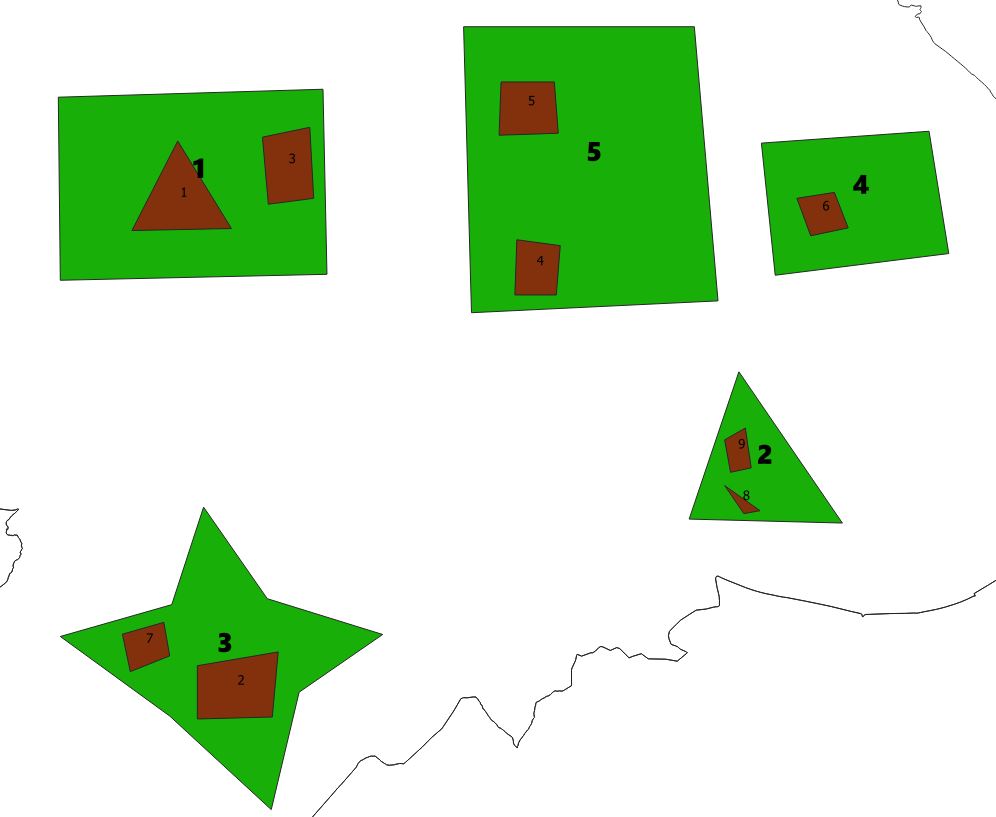
    And this is what I am seeing when viewed through QGIS = many of the fields are smaller than the plots and so although 1 2 look like they should be in the view because the plot is not WITHIN the field it does not show which is the correct response in this case.

    Postgres – create a trigger to automatically calculate area of Polygon on edit

    This will calculate the area in hectares of a polygon on creation or edit..( referenced here as Before Insert or Update On)

    This appears to work for polygon and multi-polygon geometry types I have had a discussion with a colleague and he has indicated that the type of project may affect the accuracy of the measurement. Certainly there is a straight division in there so it would probably be possible to alter the division figure by empircally testing to get it as accurate as possible. Apparently with some popular projections the further north you are the less accurate the resultant figure. (Just something to bear in mind).

    CREATE OR REPLACE FUNCTION calc_area() 
    RETURNS trigger AS $BODY$ 
    BEGIN NEW.grossarea := ROUND((st_area(NEW.geom)/10000)::numeric,2); 
    RETURN NEW; 
    END; 
    $BODY$ LANGUAGE plpgsql; 

    What I found interesting about this was the field name is defined in the function and called from the trigger. There is possibly a better way of writing this to define the field in the trigger itself..

    And the trigger that goes on the table

    CREATE TRIGGER area_calculate BEFORE INSERT OR UPDATE ON public.t001landparcels FOR EACH ROW EXECUTE PROCEDURE calc_area();

    021 Postgres with PostGIS plugin – Create junction table sites in catchments

    This is a working example of how it would be possible to set up code that would automatically allocate for example housing sites to School Catchment areas. It could also be used to list constraints relevant to particular housing sites. This is more complicated in that it will indicate what percentage of the housing site is within which catchment areas and therefore allows for a single housing site being in multiple catchment areas. I am planning on coming back and expanding on this post. In this respect it represents a refinement of this Post

    So we need two tables

    t001asites which has a geometry field called geom
    and another table which will be the catchments table called
    t002bcatchments which has a geometry field called geom.

    Both tables must have a serial primary key of pkid and both tables must be polygon data and the geom field MUST be defined as polygon and NOT multipolygon.

    Air code is as follows.

      1. Create table containing digitised polygons of housing sites.
      2. Create table containing digitised polygons of catchments.
      3. Measure the area of the housing sites and place that value in an area column within the housing sites table t001asites.
      4. Split the housing sites by the catchment boundaries ensuing that each split polygon inherits the catchment it was split by.
      5. Re-measure the areas of these split sites and add an area column to store the new calculations.
      6. Divide figure obtained in 5. by figure obtained in 3 which will indicate the proportion of the housing site is in which catchment.
      7. Perform a least remainder method on the individual sites grouped by their original housing sites to ensure the proportions sum to 1.

    So to the code

    BEGIN;
    SET LOCAL check_function_bodies TO FALSE;
    CREATE OR REPLACE FUNCTION part01catchjunctionmaker() returns void as $$
    Alter table t001asites add column area integer;
    $$ LANGUAGE SQL;
    CREATE OR REPLACE FUNCTION part02catchjunctionmaker() returns void as $$
    Update t001asites set area=ST_Area(geom);
    $$ LANGUAGE SQL;
    CREATE OR REPLACE FUNCTION part022catchjunctionmaker() RETURNS void AS $$
    DROP TABLE IF EXISTS t200;
    $$ LANGUAGE SQL;
    CREATE OR REPLACE FUNCTION part03catchjunctionmaker() RETURNS void AS $$
    CREATE TABLE t200 AS select a.pkid as t001pkid, b.pkid as t002pkid, a.area as t001area, ST_intersection(a.geom, b.geom) as geom FROM t001asites a, t002bcatchments b;
    $$ LANGUAGE SQL;
    CREATE OR REPLACE FUNCTION part04catchjunctionmaker() RETURNS void AS $$
    ALTER TABLE t200 add column pkid serial primary key, add column area integer,add column proportion decimal (10,9);
    $$ LANGUAGE SQL;
    CREATE OR REPLACE FUNCTION part06catchjunctionmaker() RETURNS void AS $$
    UPDATE t200 SET area=ST_Area(geom);
    $$ LANGUAGE SQL;
    CREATE OR REPLACE FUNCTION part07catchjunctionmaker() RETURNS void AS $$
    DELETE from t200 where area=0 or null;
    $$ LANGUAGE SQL;
    CREATE OR REPLACE FUNCTION part08catchjunctionmaker() RETURNS void AS $$
    UPDATE t200 SET proportion= cast(area as decimal)/cast(t001area as decimal) WHERE area > 0;
    $$ LANGUAGE SQL;
    CREATE OR REPLACE FUNCTION part088catchjunctionmaker() RETURNS void AS $$
    DROP table IF EXISTS t201;
    $$ LANGUAGE SQL;
    CREATE OR REPLACE FUNCTION part09catchjunctionmaker() RETURNS void AS $$
    Create table t201 as Select pkid,t001pkid,t002pkid, t001area, area, proportion, sum(proportion) OVER (PARTITION BY t001pkid ORDER BY t001pkid, proportion) as cum_proportion FROM t200 ORDER BY t001pkid, proportion;
    $$ LANGUAGE SQL;
    CREATE OR REPLACE FUNCTION part10catchjunctionmaker() RETURNS void AS $$
    Alter table t201 add column value decimal (14,9),
    Add column valuerounded integer,
    Add column cumulvaluerounded integer,
    Add column prevbaseline integer,
    Add column roundproportion integer;
    $$ LANGUAGE SQL;
    CREATE OR REPLACE FUNCTION part11catchjunctionmaker() RETURNS void AS $$
    UPDATE t201 set value = proportion * 100;
    $$ LANGUAGE SQL;
    CREATE OR REPLACE FUNCTION part12catchjunctionmaker() RETURNS void AS $$
    UPDATE t201 set valuerounded = round(value,0);
    $$ LANGUAGE SQL;
    CREATE OR REPLACE FUNCTION part13catchjunctionmaker() RETURNS void AS $$
    update t201 set cumulvaluerounded = round((cum_proportion*100),0);
    $$ LANGUAGE SQL;
    CREATE OR REPLACE FUNCTION part14catchjunctionmaker() RETURNS void AS $$
    update t201 set cumulvaluerounded=100 where cumulvaluerounded = 101;
    $$ LANGUAGE SQL;
    CREATE OR REPLACE FUNCTION part15catchjunctionmaker() RETURNS void AS $$
    update t201 set prevbaseline = round((cum_proportion - proportion)*100);
    $$ LANGUAGE SQL;
    CREATE OR REPLACE FUNCTION part16catchjunctionmaker() RETURNS void AS $$
    update t201 set roundproportion = (cumulvaluerounded-prevbaseline);
    $$ LANGUAGE SQL;
    CREATE OR REPLACE FUNCTION part17catchjunctionmaker() RETURNS void AS $$
    DELETE from t201 where roundproportion=0 or null;
    $$ LANGUAGE SQL;
    CREATE OR REPLACE FUNCTION part18catchjunctionmaker() RETURNS void AS $$
    alter table t201 add column proppercent decimal(3,2);
    $$ LANGUAGE SQL;
    CREATE OR REPLACE FUNCTION part19catchjunctionmaker() RETURNS void AS $$
    update t201 set proppercent = cast(roundproportion as decimal)/100;
    $$ LANGUAGE SQL;
    COMMIT;
    

    and now a function to pull it all together;

    CREATE OR REPLACE FUNCTION createcjt()
    RETURNS TEXT AS
    $BODY$
    BEGIN
    PERFORM part01catchjunctionmaker();
    PERFORM part02catchjunctionmaker();
    PERFORM part022catchjunctionmaker();
    PERFORM part03catchjunctionmaker();
    PERFORM part04catchjunctionmaker();
    PERFORM part06catchjunctionmaker();
    PERFORM part07catchjunctionmaker();
    PERFORM part08catchjunctionmaker();
    PERFORM part088catchjunctionmaker();
    PERFORM part09catchjunctionmaker();
    PERFORM part10catchjunctionmaker();
    PERFORM part11catchjunctionmaker();
    PERFORM part12catchjunctionmaker();
    PERFORM part13catchjunctionmaker();
    PERFORM part14catchjunctionmaker();
    PERFORM part15catchjunctionmaker();
    PERFORM part16catchjunctionmaker();
    PERFORM part17catchjunctionmaker();
    PERFORM part18catchjunctionmaker();
    PERFORM part19catchjunctionmaker();
    RETURN 'process end';
    END;
    $BODY$
    LANGUAGE plpgsql;
    

    QGIS and PostGIS : Identifying direction of a vector

    If using the dijkstra function with direction turned on it is important to identify the order in which the nodes of a vector line have been digitised. This is called the direction, dijkstra can use this with a reverse_cost attribute to handicap wrong movement along lines to such an extent that the correct path can be calculated around things like roundabouts.

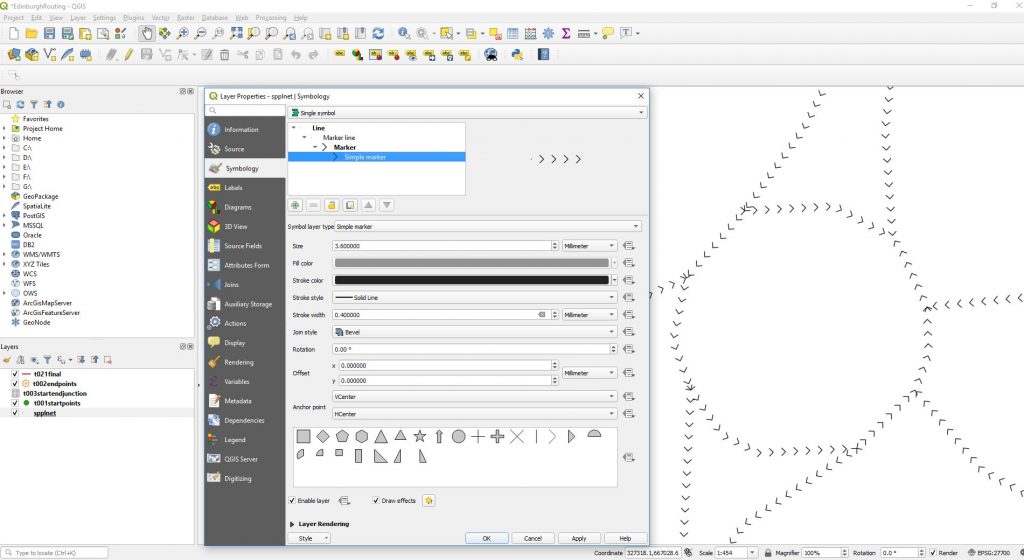
    Here is an example of the roundabout in Straiton in Edinburgh just North of the A720 bypass. While some of the lines have a correct anti clockwise orienation clearly some have been incorrectly digitised.

    First we can see this by displaying the network in QGIS but using the styling to arrow the direction.

    The function that can be used to reverse such inaccuracies if you can’t resort to buying a correct dataset try ST_REVERSE

    013 Postgres command line : psql : Using ST_Within function to build junction tables to compare 2 separate polygon tables

    First off let us create a new database to hold our examples in.

    CREATE DATABASE stwithindb;
    

    Now add the postgis extension.

    Lets create two tables one called fields and one called plots

    CREATE TABLE
    t00001fields
    (
    pkid serial primary key,
    fieldname varchar(50),
    geom geometry(polygon,27700)
    )
    ;
    CREATE TABLE
    t00002Plots
    (
    pkid serial primary key,
    plotname varchar(50),
    geom geometry(polygon,27700)
    )
    ;

    Now lets go to QGIS connect to the PostGIS instance add the tables and create some test data manually.

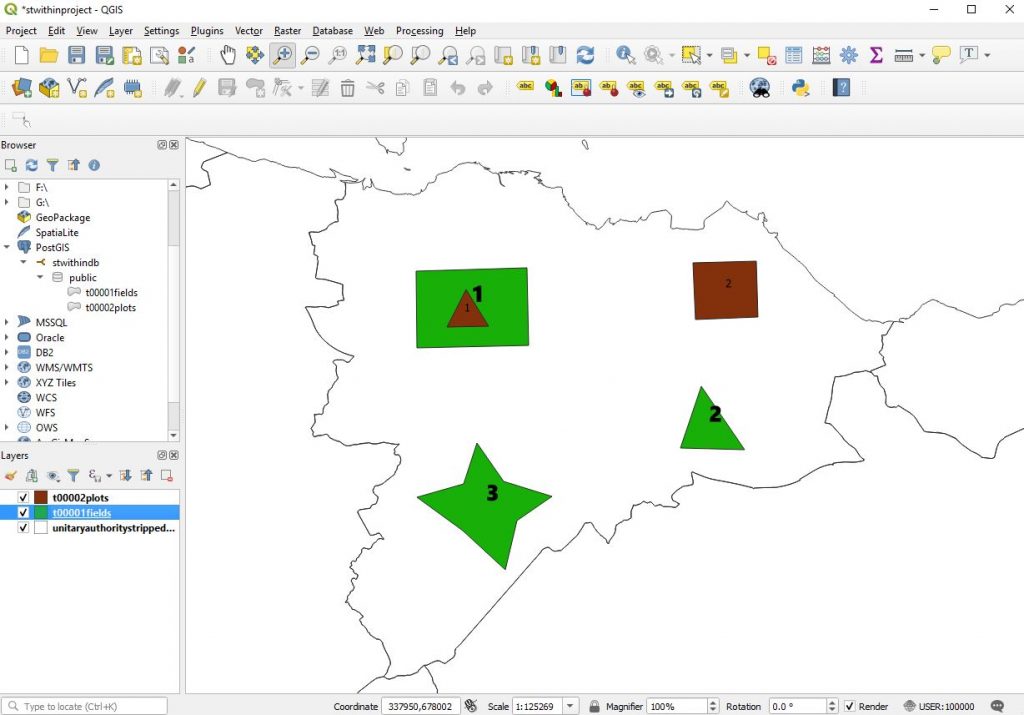
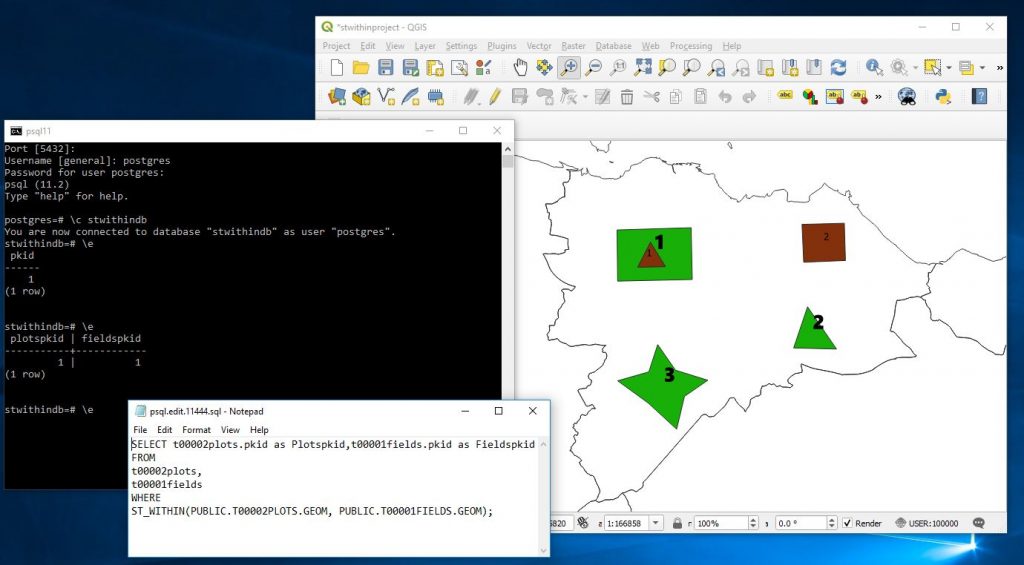
    Here I have added fields in green with bold number labels and plots in brown with smaller number labelling. The numbers represent the pkid fields.

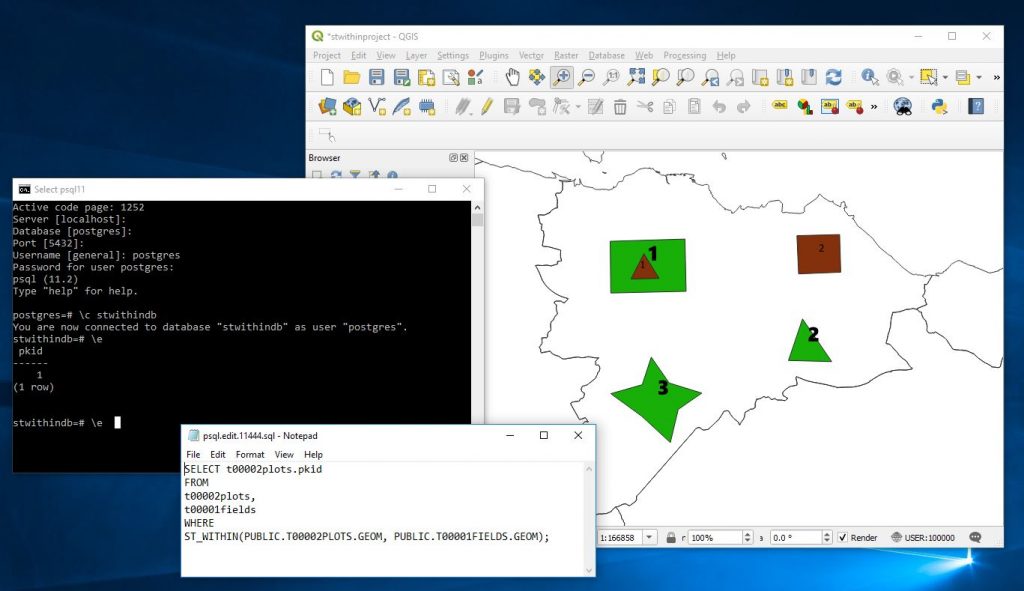
    Now here I can quickly run a query to identify the plots that are in fields

    SELECT t00002plots.pkid
    FROM
    t00002plots,
    t00001fields
    WHERE 
    ST_WITHIN(PUBLIC.T00002PLOTS.GEOM, PUBLIC.T00001FIELDS.GEOM);

    And it correctly identifies that plot 1 is within the fields layer.

    But what would be great in an application is to have some kind of junction table that individual master records could display their children on. For this we need a junction table that links between the field and plots table showing the pkids from each.

    SELECT t00002plots.pkid as Plotspkid,t00001fields.pkid as Fieldspkid
    FROM
    t00002plots,
    t00001fields
    WHERE 
    ST_WITHIN(PUBLIC.T00002PLOTS.GEOM, PUBLIC.T00001FIELDS.GEOM);

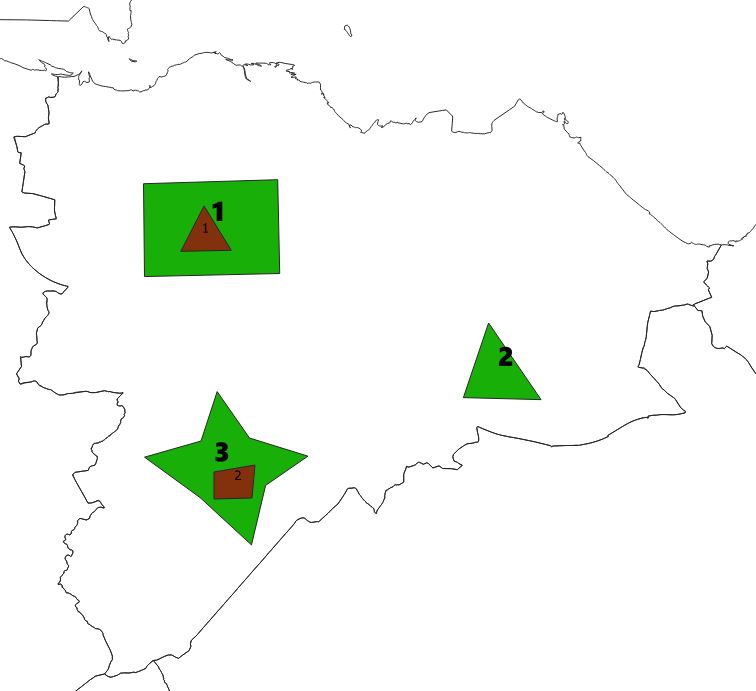
    Now I will move plot 2 into field 3 and rerun the above.

    The layer now looks like

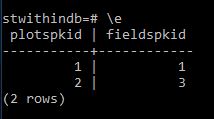
    and running the former query we get.

    Now its possible to either create a junction table to hold this information..

    eg

    CREATE TABLE t00010fieldplotjunction AS 
    SELECT t00002plots.pkid as Plotspkid,t00001fields.pkid as Fieldspkid
    FROM
    t00002plots,
    t00001fields
    WHERE 
    ST_WITHIN(PUBLIC.T00002PLOTS.GEOM, PUBLIC.T00001FIELDS.GEOM);

    or we can create a view that will constantly calculate this everytime it is seen

    CREATE VIEW v001FieldPlotJunction AS
    SELECT t00002plots.pkid as Plotspkid,t00001fields.pkid as Fieldspkid
    FROM
    t00002plots,
    t00001fields
    WHERE 
    ST_WITHIN(PUBLIC.T00002PLOTS.GEOM, PUBLIC.T00001FIELDS.GEOM);

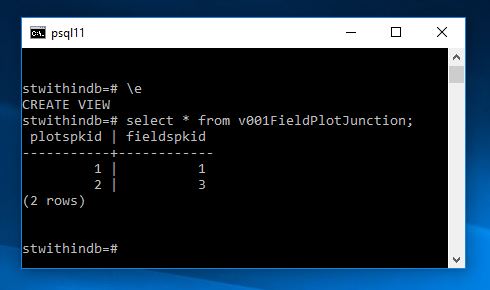
    Now if I add a few more plots and fields and then pull up the view we shall see that everything has been adjusted

    and running the view we now get

    In some circumstances this calculation may be expensive so we may wish to run and create a junction table overnight other times we may be happy to do it fully dynamically. Of course in a front end you could query and filter such that only one record was compared against the fields plot at anytime. Very useful nonetheless.

    010 Postgres command line : psql : Getting started with pgrouting using open data from Ordnance Survey to identify and measure the shortest route between two points.

    Objective here is to write a series of queries that can be used to measure the shortest distance between selected paired locations on a network such that the geometry of the routes can be calculated and displayed on a map.

    For this particular tutorial you will need – QGIS 3 or higher and a version of Postgres I am using version 11.0 here (I have upgraded since my former posts). I believe this tutorial will work with previous versions but if you are following along now might be a good time to upgrade.

    QGIS 3.4 or higher – needed as the Ordnance Survey road network geometry contains a z coordinate which will prevent the creation of the required geometry for measurement. QGIS 3 introduced the ability to save geometry excluding z coordinate. If you have a network without z coordinates you should not require this.

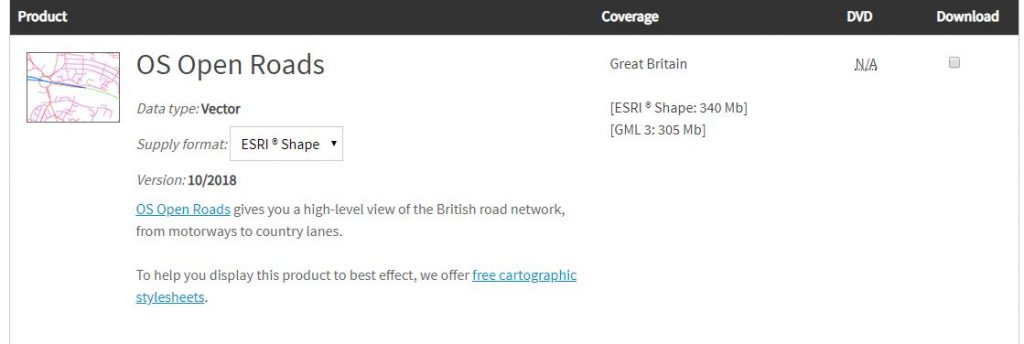
    So let us first get the data. Here you tick the option in the top right hand corner – scroll to the bottom and submit your request after which you will be asked a few basic questions along with email address you wish the download to be sent to after a few minutes you should be sent the download link through your email – follow the instructions and you should be able to get the information

    Ordnance Survey Open Data

    The information you are downloading is a block framework for the whole of the uk. When you unzip the download into a folder you will see multiple files. We will be using a section of the national dataset relating to Edinburgh – NT. Choose the block or selection that you are interested in. More blocks may take more time however.

    Open QGIS
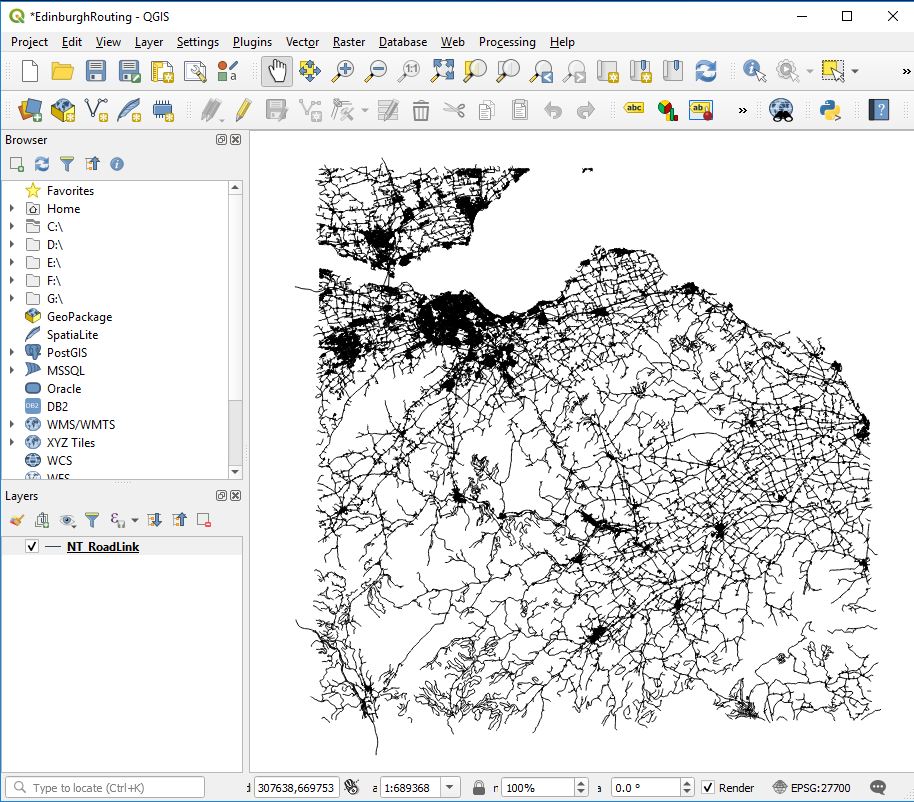
    Create a new project : eg EdinburghRouting.qgz
    Load in your chosen network block : eg NT_RoadLink.shp

    Select the layer you just loaded in : eg NT_RoadLink.shp

    and navigate to the following in the menu settings
    Layer / Save As

    Fill out the Save Vector Layer as … dialog box
    IMPORTANT – ensure within the Geometry section
    Geometry type is set to LineString
    Include z-dimension is unticked

    Give the new file a name : eg ntosroutingnetwork.shp

    Hit ok

    Within the layer dialog of QGIS your new layer should appear you can now remove the for NT_RoadLink shape file from the project

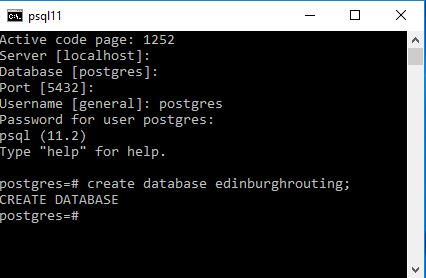
    Next go to your version of PostgreSQL and using a superuser account create a new database : eg edinburghrouting

    I would suggest you use lower casing as well

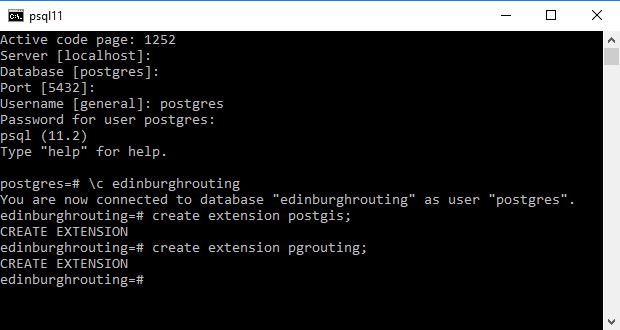
    As a superuser ensure you add the postgis and pgrouting extensions.

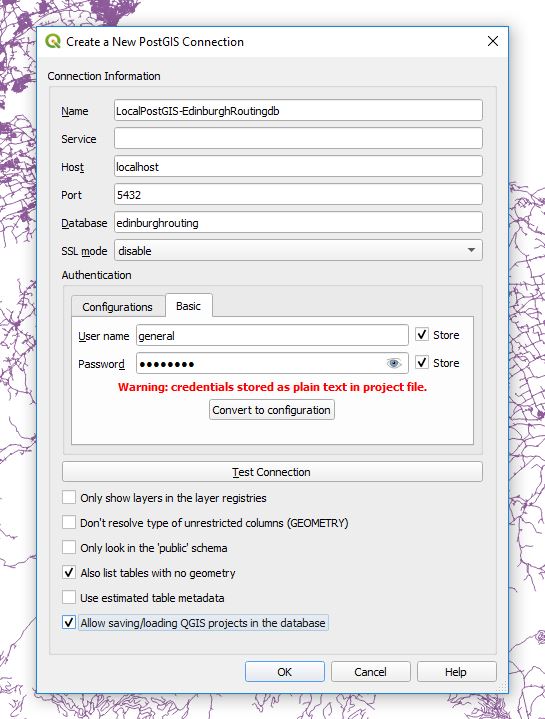
    Next I set up the following connection between the QGIS project and PostgreSQL

    Personal tastes may vary but I like like to select
    Also list tables with no geometry
    Allow saving/loading QGIS projects in the database

    OK the selection and you should now have a connection to the new database you just created.

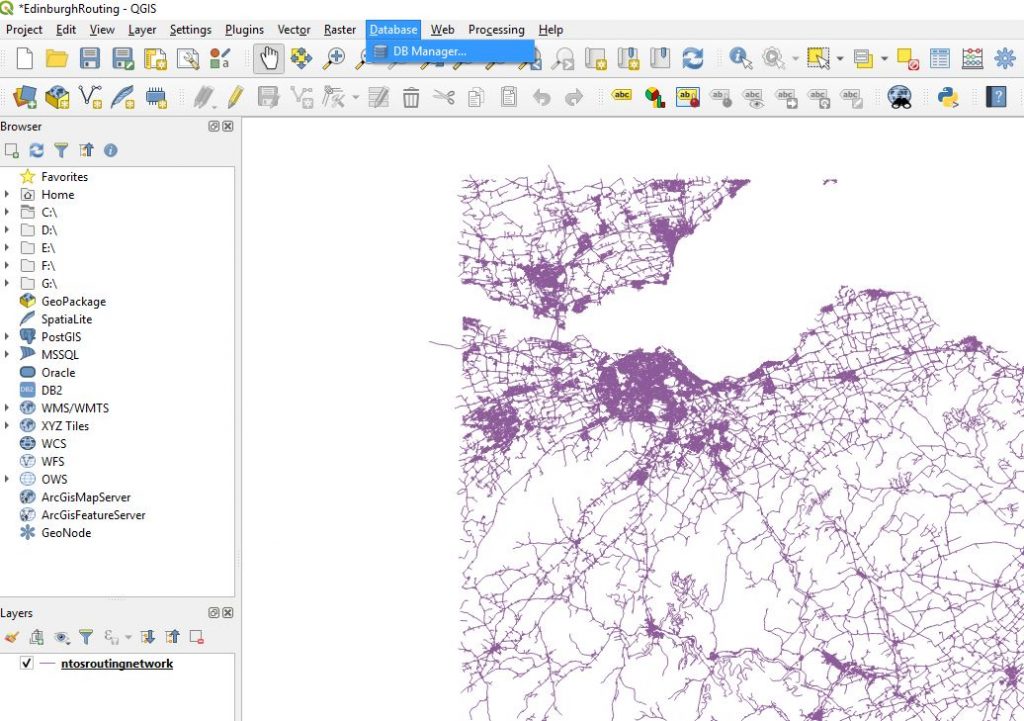
    QGIS has an excellent dbmanager window which we will use to load our new shape file which excludes the z layer into the new database we created in PostgreSQL

    Ensuring that you have a connection to your localpostgis database hit the

    ImportLayerFile

    Here I load the information into a new table t01roadnetwork

    On pressing OK there will be delay after which if things go well you will receive the following message.

    As ever it is good to check that things appear to be going well.
    Add the layer to your project and determine approximately whether import was successful.

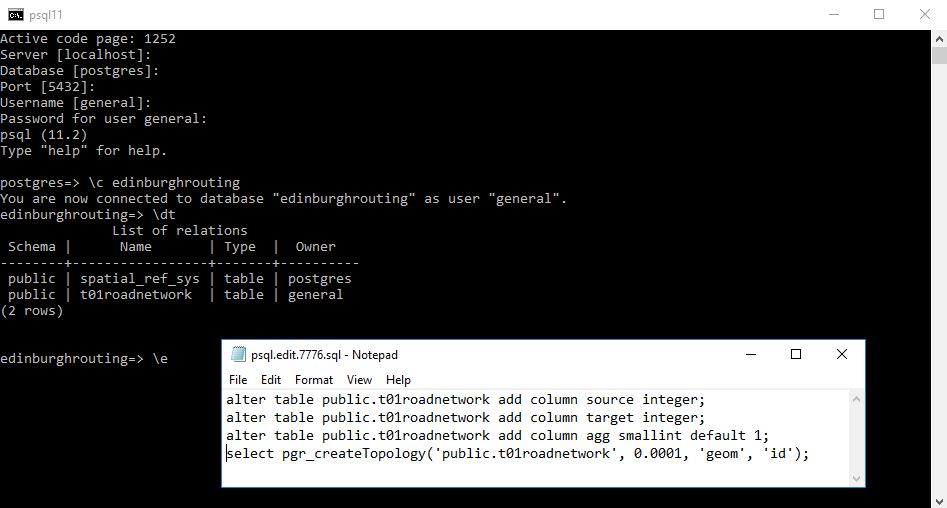
    Next back in psql command line and in an editor we are going to run 4 queries
    The first 2 add columns that are required in the shortest distance algorithm we shall use, the third will allow anyone to write an aggregation function to see the total cost of the route and the last creates a topology for the road network.

    alter table public.t01roadnetwork add column source integer;
    alter table public.t01roadnetwork add column target integer;
    alter table public.t01roadnetwork add column agg smallint default 1;
    select pgr_createTopology('public.t01roadnetwork', 0.0001, 'geom', 'id');
    

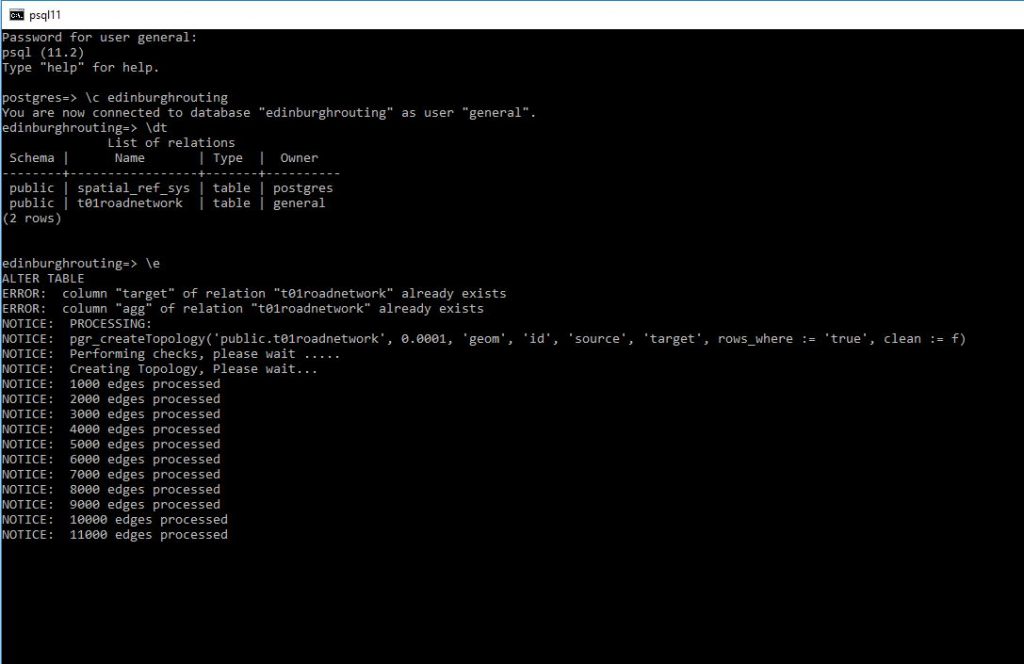
    If things go correctly you should see the database engine start to create the topology and what I see is it gradually stepping through the creation process.

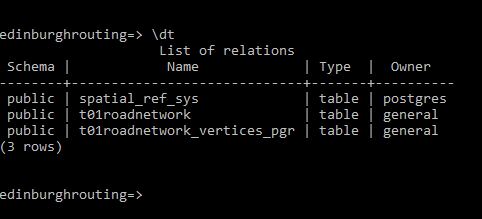
    and on completion you should have something like the following:

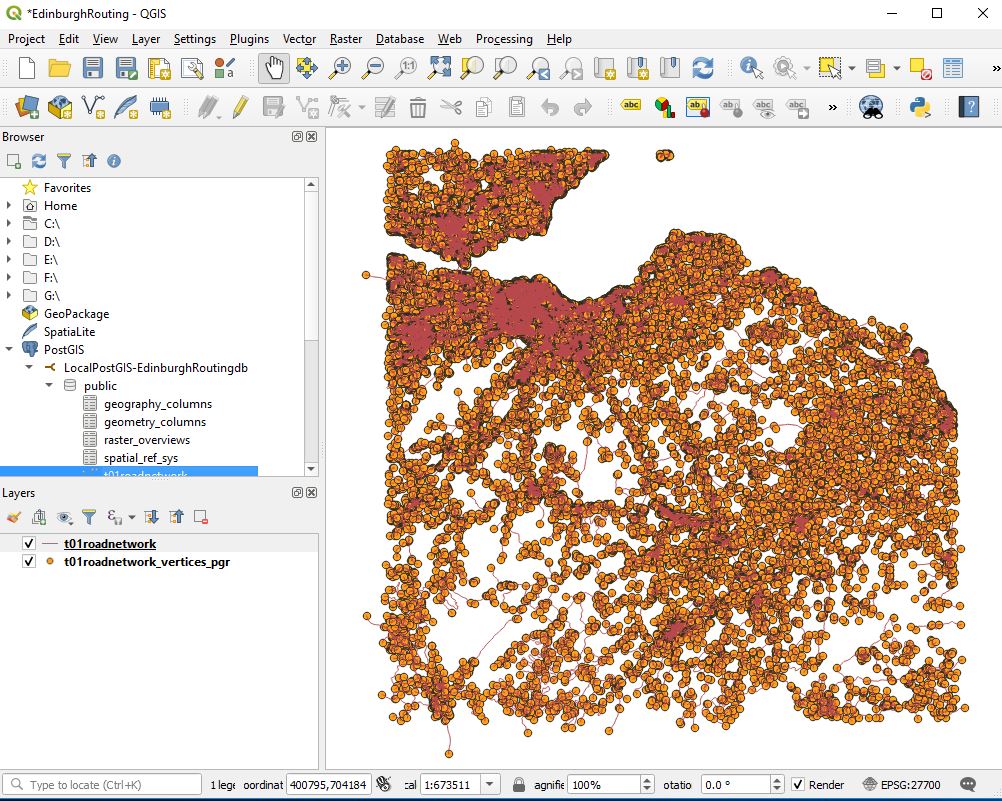
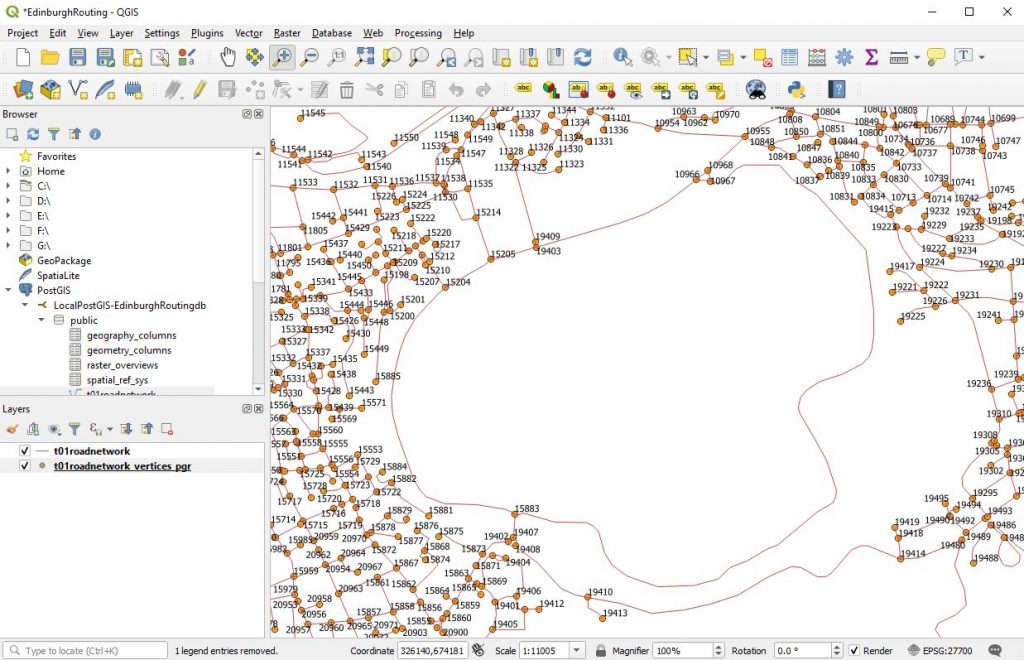
    A new table has been added to the edinburghrouting database and next step is to display the network and its vertices. In QGIS.

    In QGIS we should see something like

    The next thing that I like to do is to label the nodes so that for quick identification.

    And look to the t01roadnetwork table and see if the columns are clear and present.

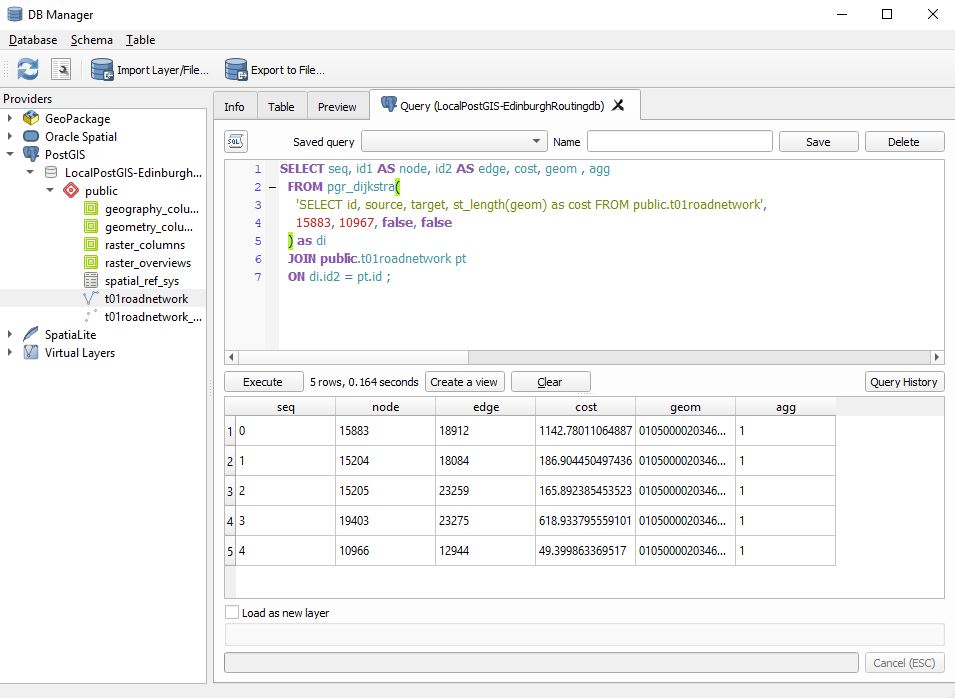
    We are now ready to make a measurement. Here I choose the nodes 15883 and 10967

    SELECT seq, id1 AS node, id2 AS edge, cost, geom , agg
      FROM pgr_dijkstra(
        'SELECT id, source, target, st_length(geom) as cost FROM public.t01roadnetwork',
        15883, 10967, false, false
      ) as di
      JOIN public.t01roadnetwork pt
      ON di.id2 = pt.id ;

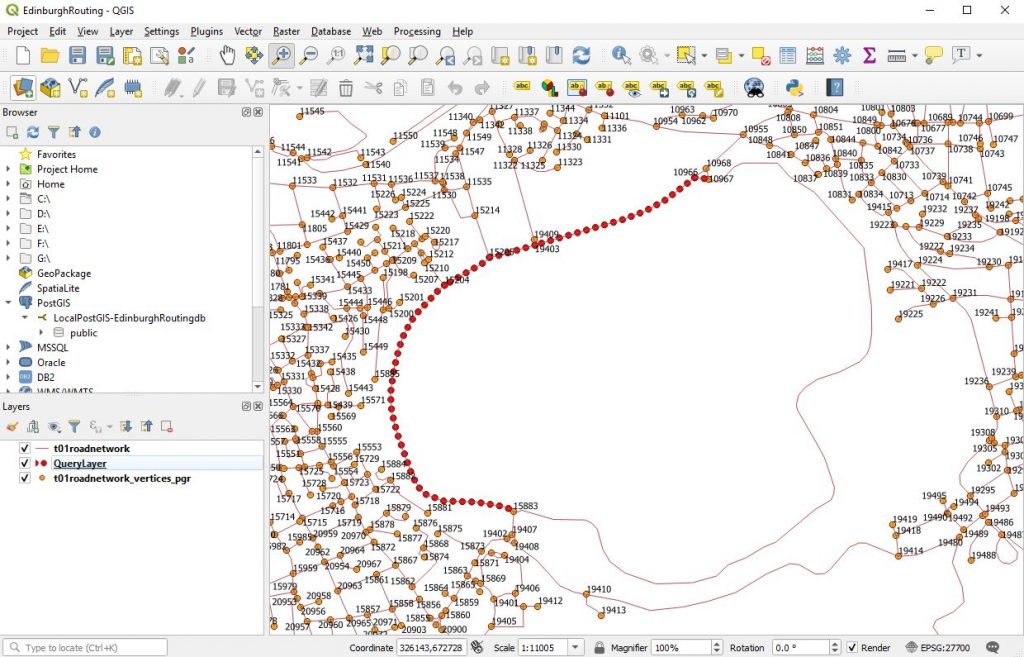
    Now we can load this as a new layer and then improve the symbology

    Doing this we get.

    It should be noted that the line you see is a collection of lines. In my next post I will go through and indicate how we can amalgamate that into a single line for storage in a table.

    Congratulations if you have got this far you should be able to measure the shortest distance between any two points on a valid network by altering the numbers.

    004 Postgres Command Line : psql : Create a spatially enabled table

    For this you will need to have a version of Postgres Database engine installed and running and you will need to have created a database which has the PostGis extension installed.

    Open psql
    Login to the database you wish to create the table in

    type the following

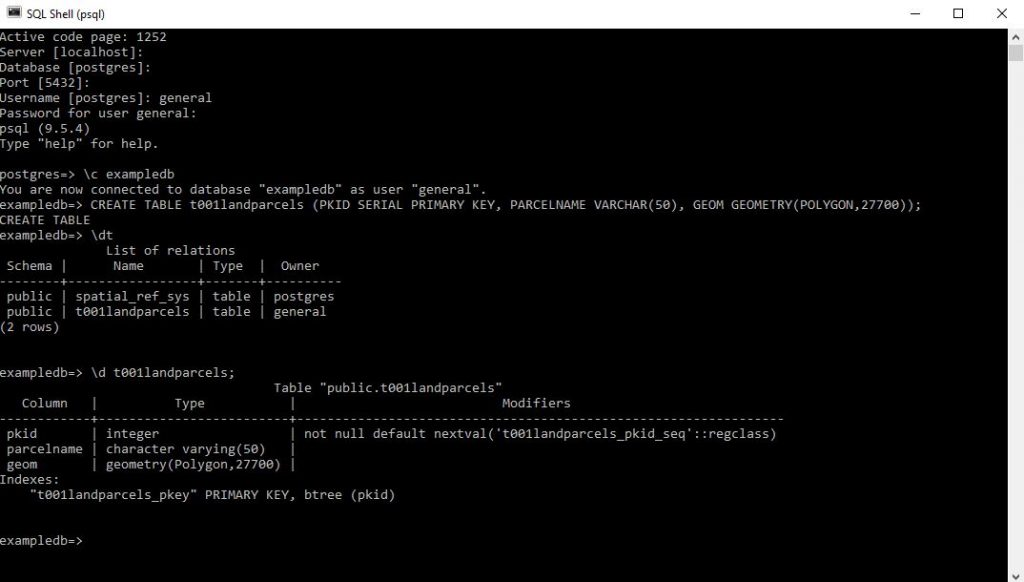
    CREATE TABLE t001landparcels (PKID SERIAL PRIMARY KEY, PARCELNAME VARCHAR(50), GEOM GEOMETRY(POLYGON,27700));

    Here I do this and then check on the tables with the \dt command before inspecting the columns itself using the \d command.

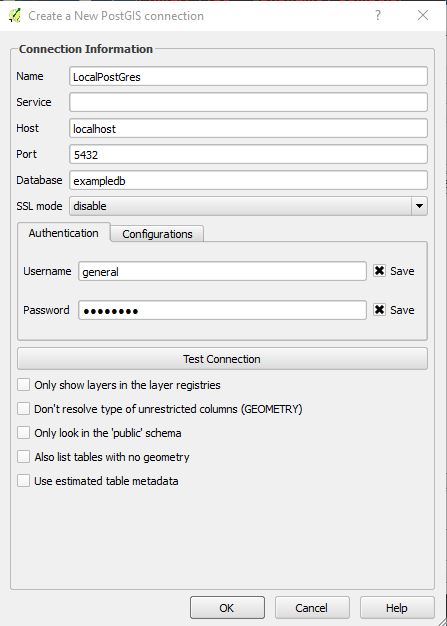
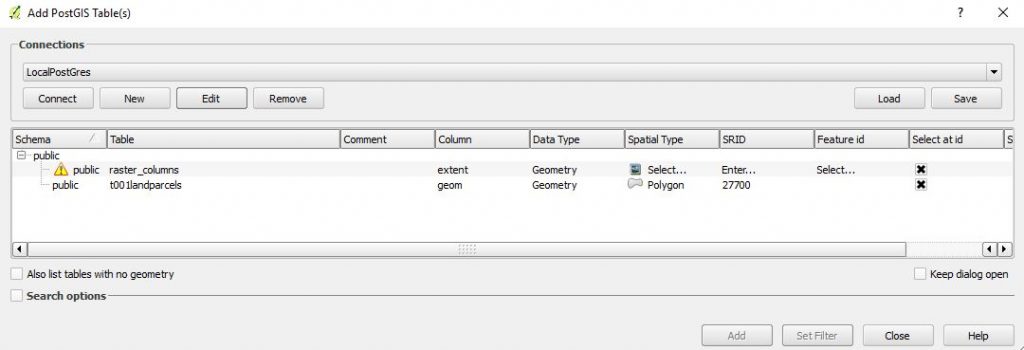
    and here I open up QGIS and link to my local postgres instance and the exampledb database;

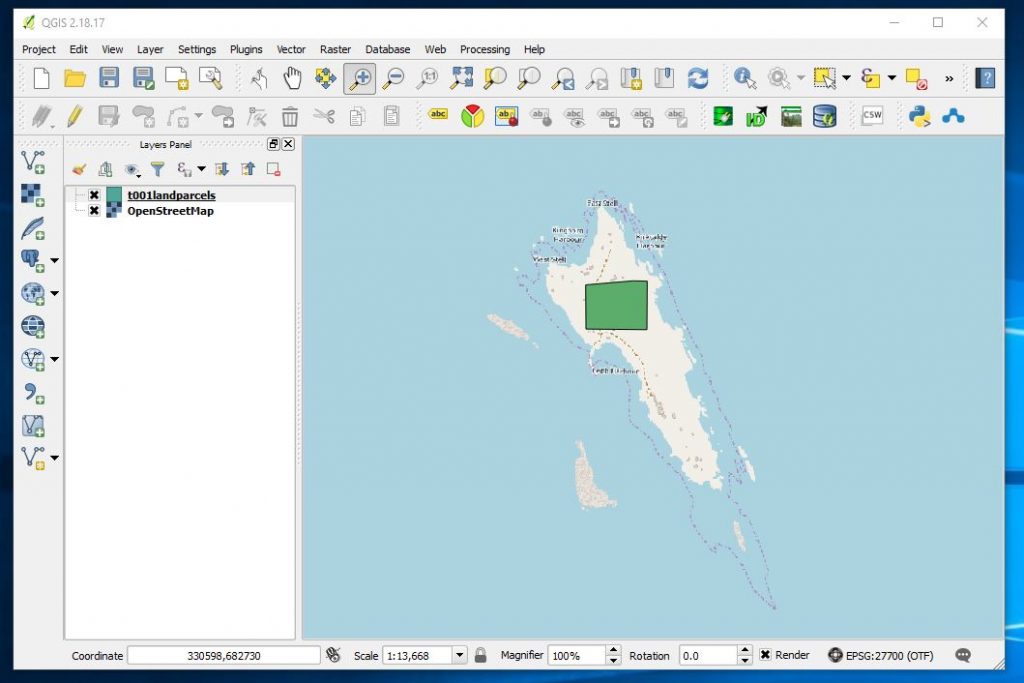
    and here I connect to it and draw a polygon. If you are wondering where it is this is InchKeith in the Firth of Forth and island very visible from George Street in Edinburgh. If you have flown into Edinburgh you will have flown almost over it.

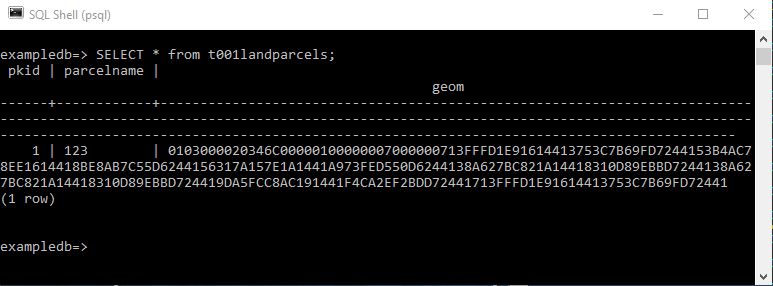
    and here after having digitised a single polygon I look at the contents of the table

    SELECT count(*) FROM t001landparcels;

    Produces the more helpful count of records in the table.

    002 Postgres Command Line : psql : Enabling extensions (PostGIS) to a database

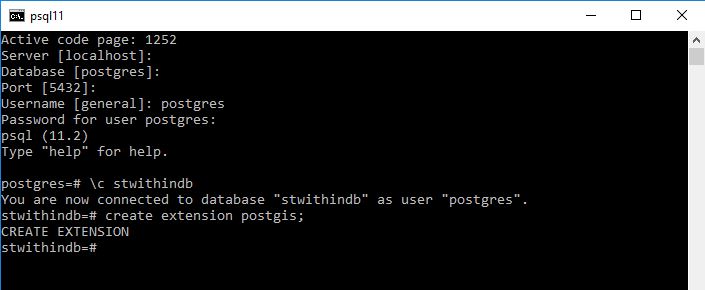
    So you have an existing database in PostGres that you wish to add the PostGIS extension to.

    You will need to be logged in with a username that has superuser privileges.
    Here let me do this using the postgres default account that on my instance has superuser access.

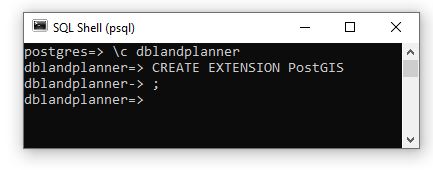
    Here rather than logging in at the start I am choosing to change the connection to a different database

    This is done by using

    \c DatabaseName;

    or

    \connect DatabaseName;

    Please note that the semicolon is vital in performing the instruction.

    The way I have discovered to do this is by opening the database and then allocating the postgis extension to the database once it is open.

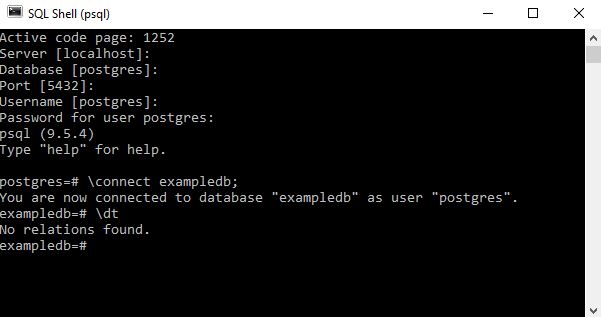
    Let us first examine the tables in our blank database before the extension is enabled.

    \dt

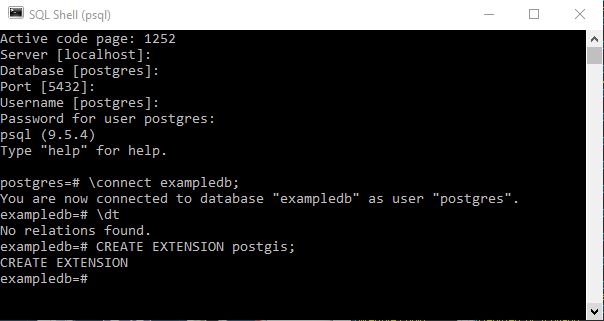
    Now let us enable the extension.

    CREATE EXTENSION postgis;

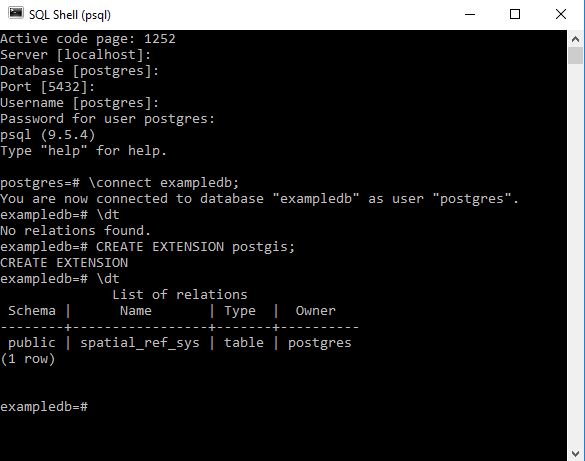
    Let us now examine the database tables

    \dt

    Enabling the PostGIS extension adds this table along with the ability to add geometry types of varaibles within tables.

    001 Postgres Command Line : psql : Getting Started with Postgres

    I am just getting into PostGres and here are some rough notes for my reference.

    Assuming you have a postgres admin account you want to sign in first of all and create a database

    To find the command line go to search in Windows and type psql

    Ensure that your postgres engine is running firstly

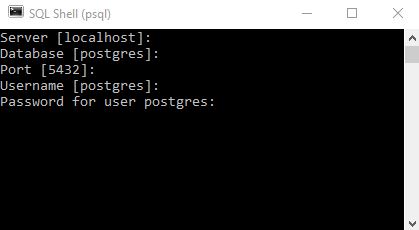
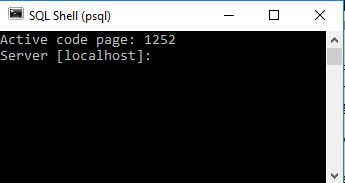
    You should be presented with the following

    There are default connections to the local host keep hitting these initially until you reach the following;

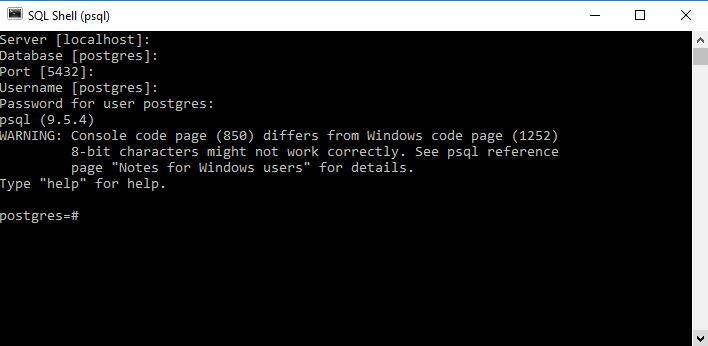
    You will now need to know your password enter it here and press return

    I will deal with the warning message further in the post – but a lot of people experience this message so I wanted to keep it in at present.

    From my initial investigations as ever it is a good idea to restrict users to particular privileges at this level I am not being particularly refined – I would like to have a poweruser role that I can allocate to people and give this a defined password.

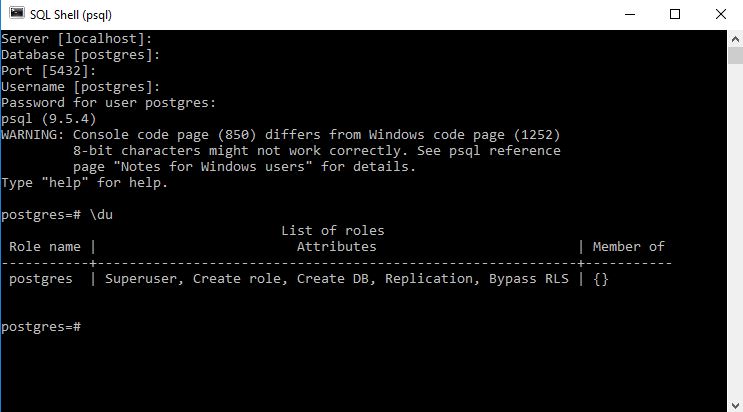
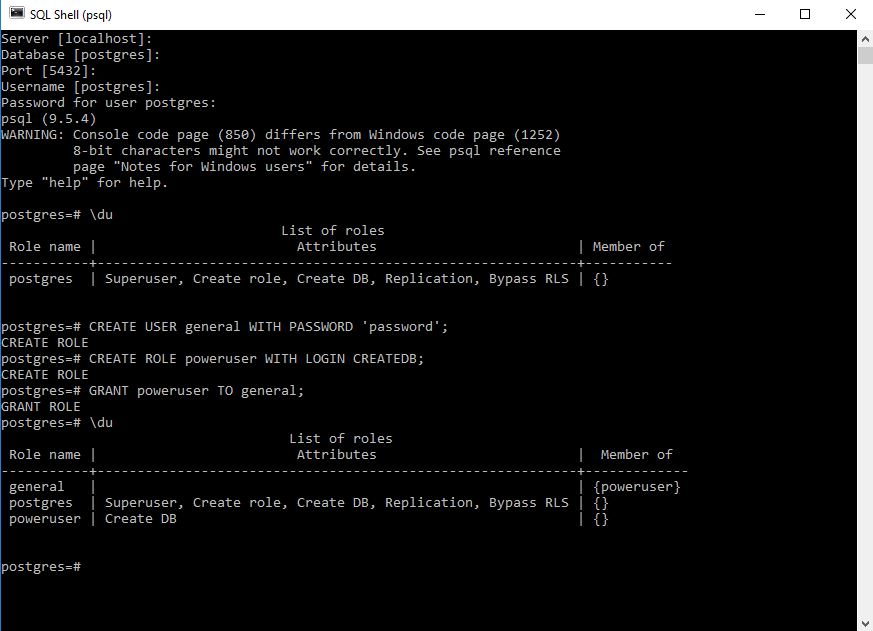
    Signing in you can check out the roles and users as follows – on starting up a new instance you may well see something like this \du

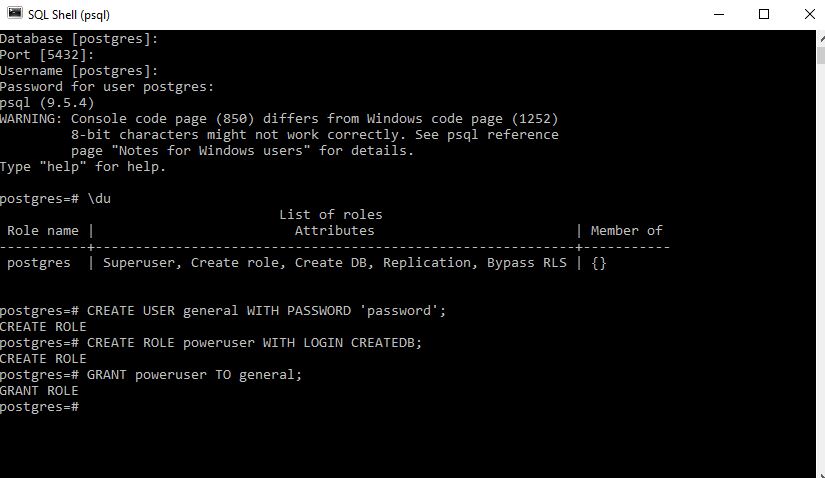
    So here I try and set up a user called general and create a role called general which I give create DB rights

    I would recommend something stronger than the classic password password.

    Issuing the \du command again we get to see the roles

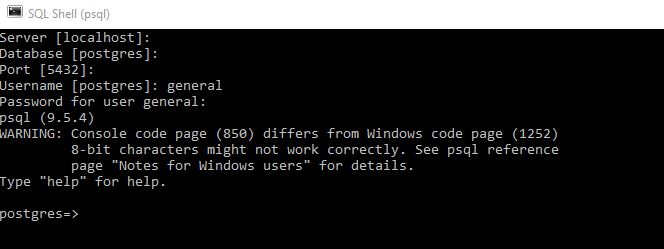
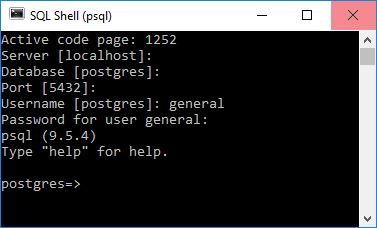
    Now we can close down and go back in but this time login as username general by altering the appropriate item when asked.

    Note how the =# characters have been replaced by => this appears to denote the non superuser sign in.

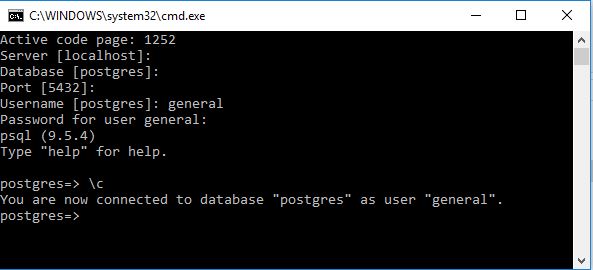
    To identify what username you are logged in as type \c at the prompt

    My investigations suggest that the # sign denotes that you are logged into the database as superuser.

    So first of all lets get rid of that annoying warning message when you log in at psql

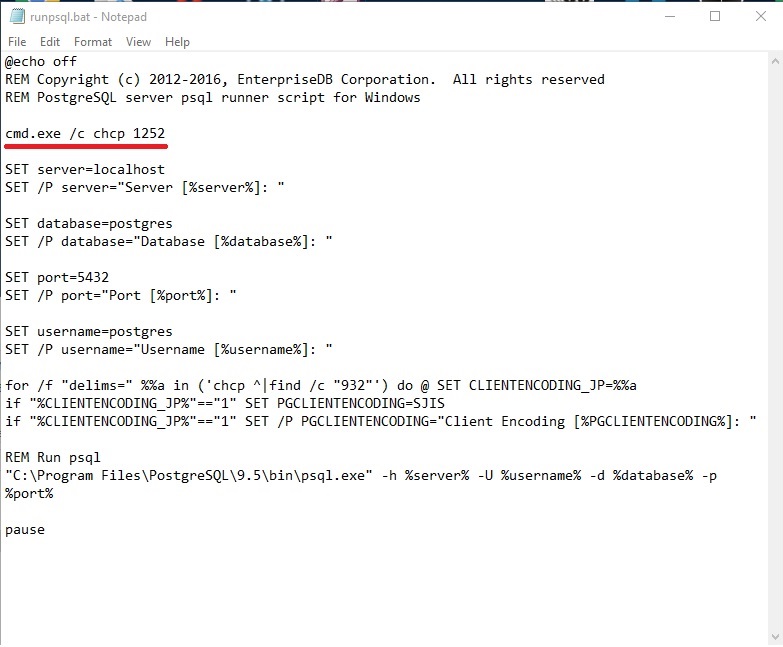
    I am running Postgres version 9.5 your version may vary but you can remove the warning by editing runpsql.bat file every version of postgres has this file and it will be located in the version equivalent directory to 9.5 for me.

    C:\Program Files\PostgreSQL\9.5\scripts

    Add the line

    cmd.exe /c chcp 1252

    as per underline and save the file

    Now fire up psql as usual you should get the following

    It should be noted that if you REM out the SET statements you can choose login with particular server / localhost / database / port and username presets which may be useful if you find yourself constantly going into a particular database as a particular user.

    Here you see that the warning note has stopped.

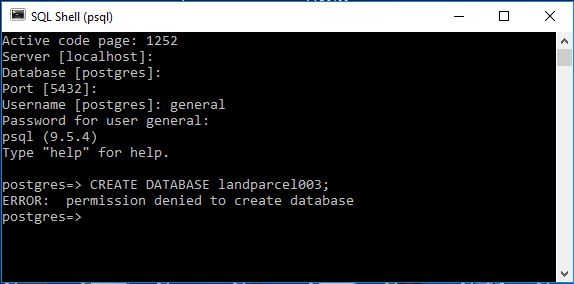
    It should be noted that using the general username you will NOT be able to create Databases

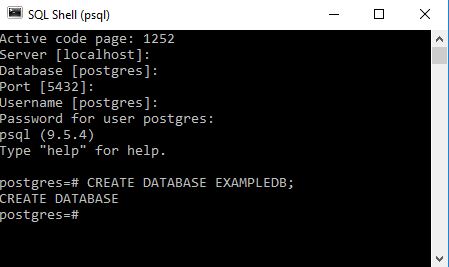
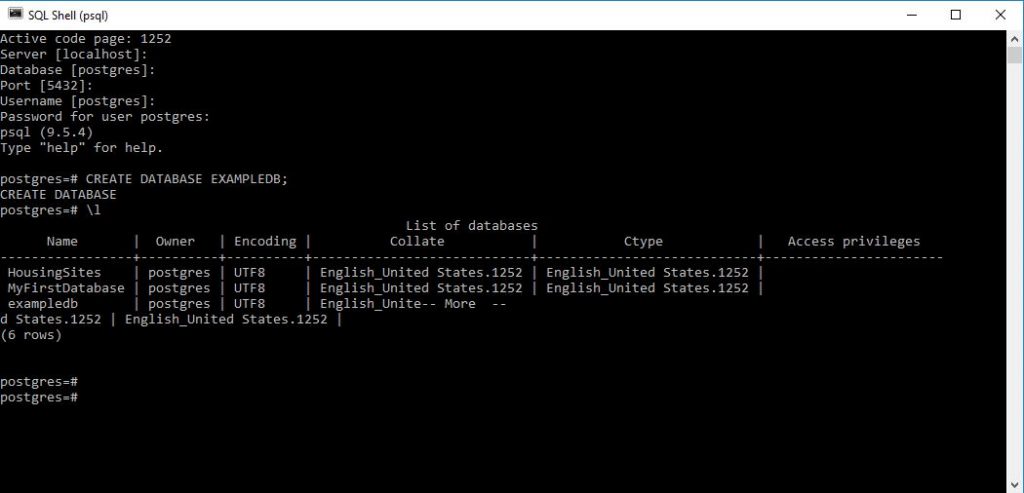
    In order to CREATE databases you will have to be signed in with a username with sufficient privileges here I am in as postgres and I create a database called ExampleDB

    You can see that on carrying out a successful command we usually see a repeat of the command.

    To get a list of all databases in the instance type

    \l

    It can be seen that despite typing the name in capitals the database has been created in lower case this seems to be a feature of commandline. If you desperately want capitals you may need to go to pgadmin tool.

    I think I’ll end it there for now.

    MS Access Function – import all CSV files from a directory with the same structure into a single table

    This is a really nice function that can be used to place all data from multiple CSVs (with the same structure) into a single table.
    Here I use the Ordnance Survey’s excellent Code Point data set that gives postcodes in the UK along with eastings and northings as an example – This lists each postcode in the UK along with further administrative categories. Apologies to anyone from outside of the UK that may not be able to access these files I hope the demonstration is still useful. For those wishing to try please follow the links.

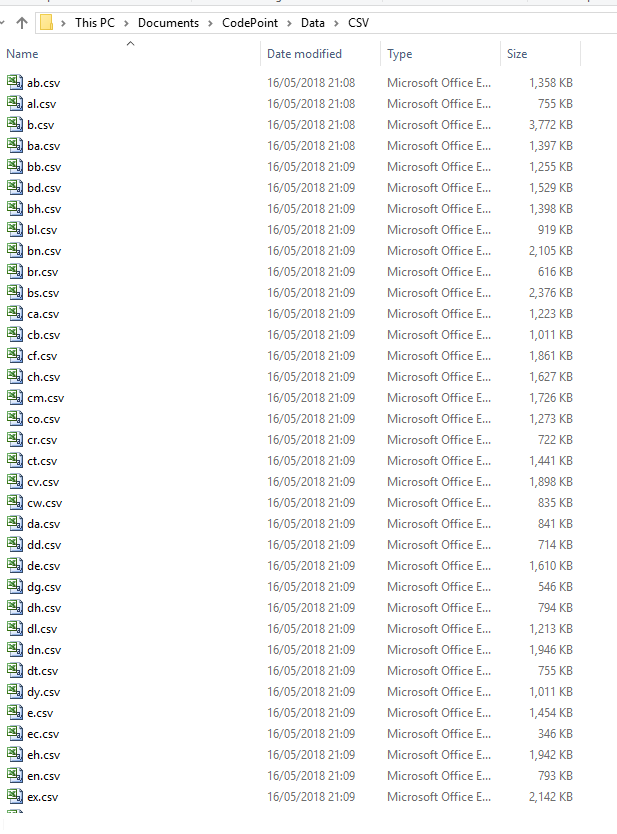
    After download you will see the problem each postcode is in a separate CSV.

    Ordnance Survey Open Data Code Point UK Postcodes

    After a short administration excercise to request a data download involving filling out your name you should be sent an email link to initiate a data download. The download consists of a zip file of two directories one named DOC one named DATA the DATA directory contains a subdirectory called CSV which at May 2018 for my download consisted of 120 csv files.

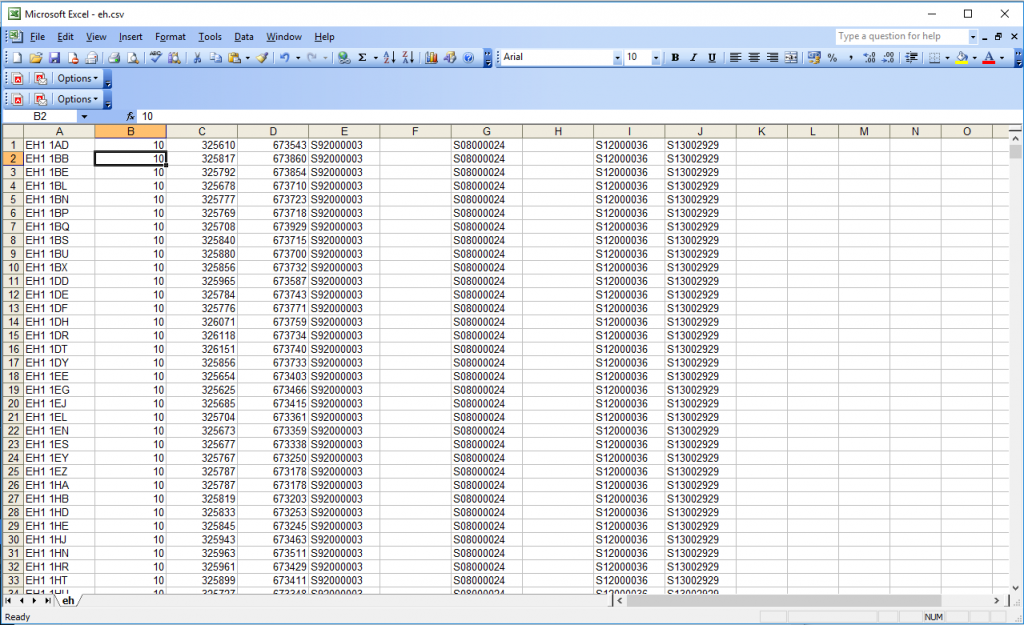
    Opening a single file ( in this case Edinburgh EH ) we see

    I’ve already figured this out here , but there are 10 fields here (some are blank in my example)

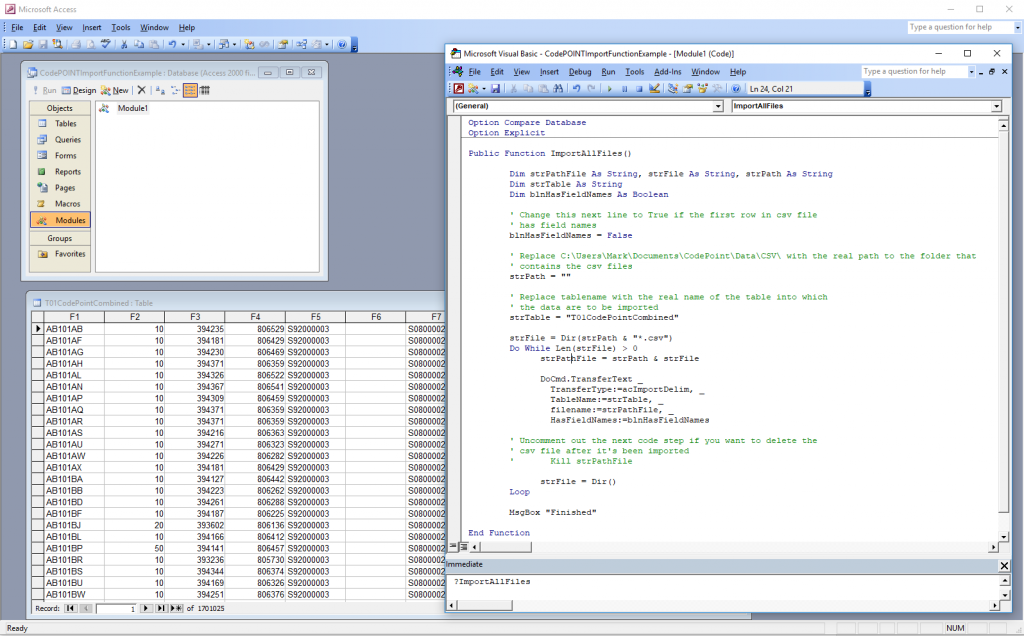
    Here I create a table called T01CodePointCombined with 10 fields marked
    F1 through to F10
    Note if you don’t create the table this function is so powerful it will do it for you

    I then create a module and ensure that all the CSV files I wish to import are in a single directory here “C:\Users\Mark\Documents\CodePoint\Data\CSV\”

    Public Function ImportAllFiles()
    
            Dim strPathFile As String, strFile As String, strPath As String
            Dim strTable As String
            Dim blnHasFieldNames As Boolean
    
            ' Change this next line to True if the first row in csv file
            ' has field names
            blnHasFieldNames = False
    
            ' Replace C:\Users\Mark\Documents\CodePoint\Data\CSV\ with the real path to the folder that
            ' Now place the location of where the csvs are within the brackets below
            strPath = "C:\Users\Mark\Documents\CodePoint\Data\CSV\"
    
            ' Replace tablename with the real name of the table into which
            ' the data are to be imported
            strTable = "T01CodePointCombined"
    
            strFile = Dir(strPath & "*.csv")
            Do While Len(strFile) > 0
                  strPathFile = strPath & strFile
    
                  DoCmd.TransferText _
                    TransferType:=acImportDelim, _
                    TableName:=strTable, _
                    filename:=strPathFile, _
                    HasFieldNames:=blnHasFieldNames
    
            ' Uncomment out the next code step if you want to delete the
            ' csv file after it's been imported
            '       Kill strPathFile
    
                  strFile = Dir()
            Loop
    
            MsgBox "Finished"
    
    End Function

    Points to note make sure all csv are closed when you run it. That’s about it takes less than 5 minutes to move all the records from those 120 files into a single table within an MS Access Database.
    After import if it’s gone correctly you should have in the region of 1.7 million records in T01CodePointCombined.

    Links to GIS information for test system design

    If you are trying to design software that includes a Geographical element it is easier if you are working with data that makes some kind of sense.

    The following are a list of sites where you can get good and consistent information on Local Authority Geographical Datasets within Scotland and in London. There has been an improvement in the quality and extent of information available but open data still remains patchy. Fortunately some datasets are available. The interesting thing about this data is that although it is rich it is largely unstructured and without relationships. Fortunately if there are geographical attributes then these can be used to spatialiy analyse the information and create relationships from which you can start to construct better systems.

    I understand why the data is patchy. To really publish well it is a necessity to get your systems working well so that the export (and publication) of data can be at least semi-automated. Without this it is simply too onerous for staff to repeatedly perform Extraction Transformation and Load procedures on ever larger numbers of datasets. Taking a step back however therein may lie the benefit. The quicker they can learn to cleanly optimise and export and hopefully automate these procedures the more likely they are to have their systems working properly and importantly the more investigation and experimentation they can put into linking their datasets. The skills to link these datasets constantly to a web data portal being similar to the skills required to link between systems.

    It might be expected therefore that better availability of open data is reflective of better internal systems.

    Here is the information that I was able to identify through Google Searches at February 2018.

    Aberdeenshire Open Data

    Angus Council Open Data Portal

    Argyll and Bute Open Data Portal

    Dundee City Open Data Portal

    Moray Council Open Data Portal

    North Ayrshire Open Data Portal

    North Lanarkshire Open Data Portal

    South Ayrshire Open Data Portal

    and scheduled ancient monument information can be obtained here.

    Historic Environment Scotland

    Here is London

    London

    Creation of SITE History from Planning Application Polygons using QGIS

    In planning it is important to know the planning history on a site. The status and likelihood of approved permission will often relate to previous permissions. Many council planning systems do not specifically relate planning applications to each other and there may be situations where you would like to create such links. This is essentially an excercise in using spatial analysis to create the junction table to hold what are many to many relationships.

    If your datasets are in any way large you will need to set aside a computer so that it can perform the calculations. When I first tried this the process took a weekend with queries running overnight.

    Start by obtaining as many years of planning application polygons as you can. Here I use polygon files in shape format.

    The polygon file or shape file should be in one file so if you need to merge the shape files you have together. I did this and the file I ended up with was

    AllPlanningApplications.shp

    Next – Delete all attribute fields EXCEPT the planning application number.

    Next – Create a centroids file from AllPlanningApplications.shp I called mine
    AllPlanningApplicationsCentroids.shp

    The next series of iterations are about getting a unique set of polygons with which we can go forward and generate a set of SITEPKIDS that can be attached to the child records.

    Step – Using AllPlanningApplications.shp ADD an additional field called area and populate it using QGIS $area calculation – save this file.

    Step – this is where it becomes interesting – in most authorities there are a vast number of planning application boundaries that overlap. Performing a dissolve at this point would result in a large congealed set of polygons that could not clearly identify unique sites. Thus buffering the polygons down we can start to identify unique sites. This is particularly important where boundaries are completely contiguous to each other.

    sites the buffering command is used within the geometry tools to try to separate adjacent overlapping and contiguous polygons.

    Step ‐ Create two files from the AllPlanningApplications.shp one for polygons less than 4500 metres squared and one for more than or equal to 4500 metres squared. This is to allow for two differing buffering processing to be performed on each.

    AllSmallLessthan4500PlanningApplications.shp

    AllLargeGreaterthanequal4500PlanningApplications.shp

    Now the 4500 is an empirical figure that was subjectively chosen there may be a better figure feel free to investigate.

    The following 2 steps also introduce empirical figures for the buffering that can be altered as appropriate.

    Step ‐ Take the file AllSmallLessthan4500PlanningApplications.shp and create a buffer polygon file of this with

    boundaries of less than 2m lets call it

    AllSmallLessthan4500PlanningApplicationsBufferMinus2.shp

    Step ‐ Take the file AllLargeGreatethanequal4500PlanningApplications.shp and create a buffer polygon file with

    boundaries of less than 20m lets call it

    AllLargeGreaterthanequal4500PlanningApplicationsMinus20.shp

    THIS NEXT STEP WILL TAKE SEVERAL HOURS IT MAY BE BEST TO DO EACH ONE OVERNIGHT

    Step ‐ Perform dissolves on both of these new files ensuring that dissolve all is used names could be something like

    Vector / Geoprocessing Tools / Dissolve /

    Set input layer alternatively to the two above files and set Dissolve field to dissolve all.

    Suggested file Names are

    MultipartDissolvedPolygonLessthan4500PlanningApplicationsBufferMinus2.shp

    MultipartDissolvedPolygonAllLargeGreaterthanequal4500PlanningApplicationsMinus20.shp

    Step You should now have two shape files of a large multipart polygon you want to perform the multipart to single part operation now

    Vector / Geometry Tools / Multipart to Single Part

    Processing involved with this is typically quick and suggested names for these files are

    DistinctPolygonsAllSmallLessthan4500PlanningApplicationsMinus2.shp

    DistinctPolygonsAllLargeGreatethanEqual4500PlanningApplicationsMinus20.shp

    Add area column and identify the largest polygon on the small files

    Add area column and identify the smallest polygon are on the large files you may want to remember this.

    Step ‐ perform merge on these two files to get

    Vector / Data Management Tools / Merge

    CombinedSmallandLargeDistinctPolygonsPlanningApplicationswithbuffering.shp

    ONGOING investigation ‐ would Difference be better than dissolve on this and should the above files be put together before

    Step ‐ perform dissolve

    Vector / GeoprocessingTools / Dissolve

    ensure that ‐‐Dissolve all‐‐ is selected

    DissolvedCombinedSmallandLargeDistinctPolygonsPlanningApplicationswithbuffering.shp

    Step now you want to split mutlipart to single

    DistinctPolygonsAllPlanningApplications.shp

    Step add field called SitePKID and populate it using $rownum command.

    Step

    Vector / Data Management Tools / Join Attributes by Location

    Set Target Vector Layer as

    AllPlanningApplicationsCentroids.shp

    Set Join Vector Layer as

    DistinctPolygonsAllPlanningApplications.shp

    Ensure that Keep all records (including non‐matching target records are kept)

    Output Shapefile suggestions

    AllPlanningApplicationsCentroidswithSitePKID.shp

    If there are centroids without Site PKIDs put them to the end and give them consecutive unique row numbers. The attribute file associated with AllPlanningApplicationsCentroidswithSitePKID.shp should now be a child table of the shape file DistinctPolygonsAllPlanningApplications.shp perform checks here to see if all centroids within a polygon defined by the distinct polygons have the same SitePKID and that it is matched by the SitePKID of the Parent shape file.

    You should be able to do a join on the this file to get the PKID back into the very original file.

    AllPlanningApplications.shp

    Finally perform a dissolve on the corrected AllPlanningApplications.shp file but this time dissolve on the field

    SitePKID

    You can call this

    DistinctCorrectedPolygonsAllPlanningApplications.shp

    QED!!!!

    QGIS – Import shape file into PostGIS Table

    The following uses
    QGIS 2.14.2 Essen and
    PostGres 9.5

    A number of local authorities have released information through the UK’s data government site. The following example uses a shape file obtained from Lichfield District Council – At 2nd of October 2016 this was available for download from the following link

    Lichfield Planning Applications

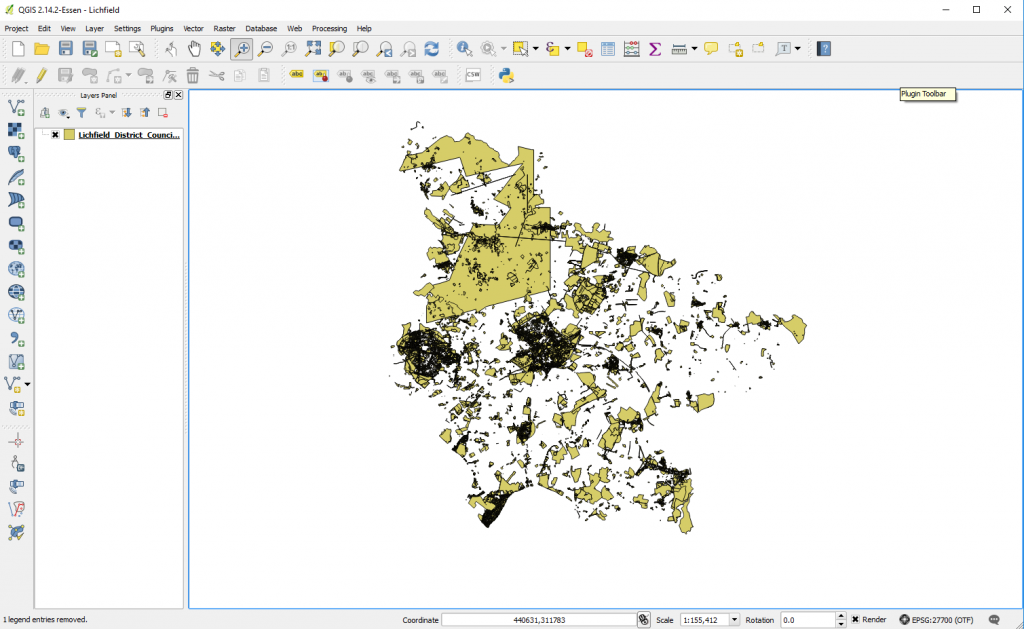
    Open up QGIS and add Lichfield’s planning application shape file
    qgisessen2142

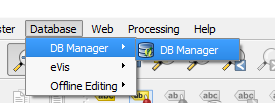
    Now scan along the top menu and go to Database

    Select the sub menu DB Manager and then DB Manager

    dbmanager

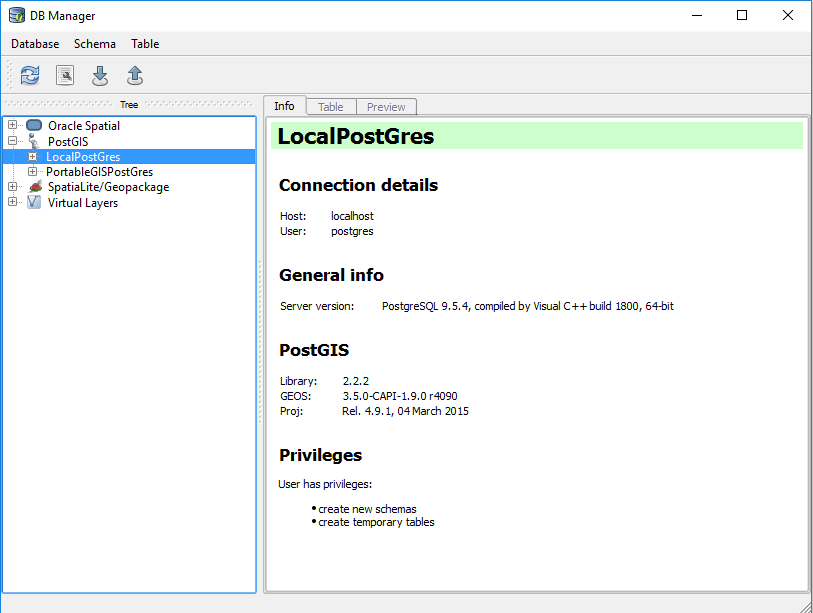
    The following windows dialog should appear

    dbmanagerdialog

    Expand the area on the left named PostGIS – any PostGIS instances that you have created should be visisble here. Note you will have to have the PostGIS server running. Then highlight the actual instance that would like to import information into.

    In this case I use the instance LocalPostGres

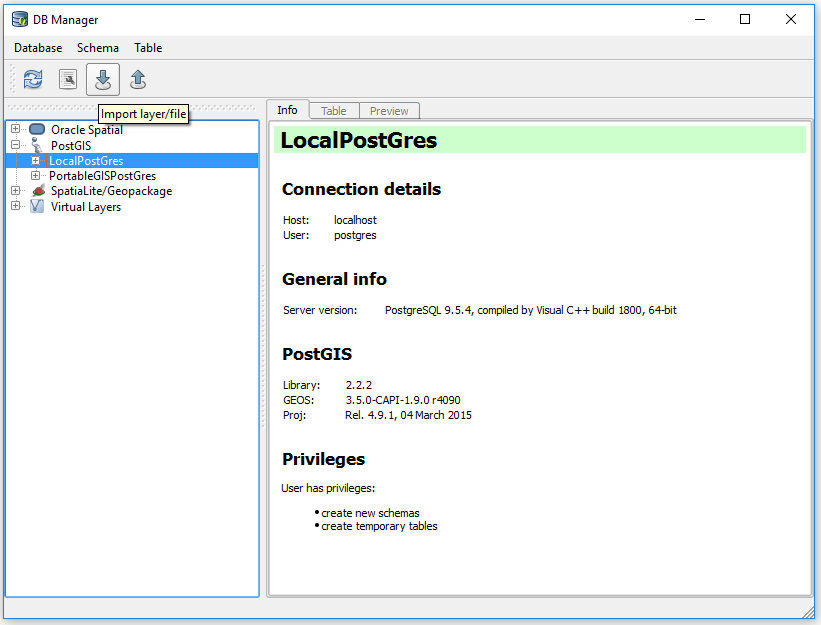
    dbmanagerdialog

    Choose the third icon from the left.
    dbmanagerimportlayerfile

    It should be noted that the window on the right may or may not show the correct connection to the database on the right.

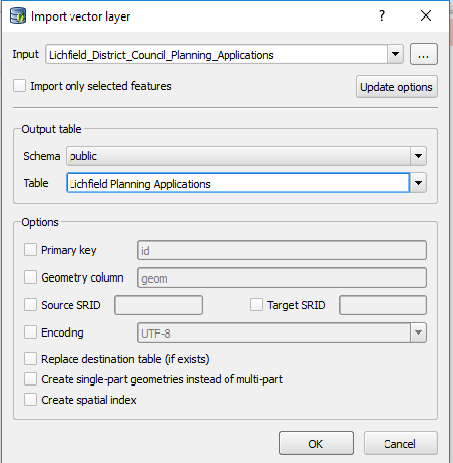
    importdialog

    Name the table you wish to create and then hit OK – additional parameters are available.
    There will be a delay before a confirmation of successful import happens – try to not issue commands during this time – once confirmation has been received go back into the PostGIS option and add the layer.

    Connecting to PostgreSQL 9.3 from QGIS 2.8.1 – local host

    First ensure that you have both Postgres and QGIS installed on your machine.

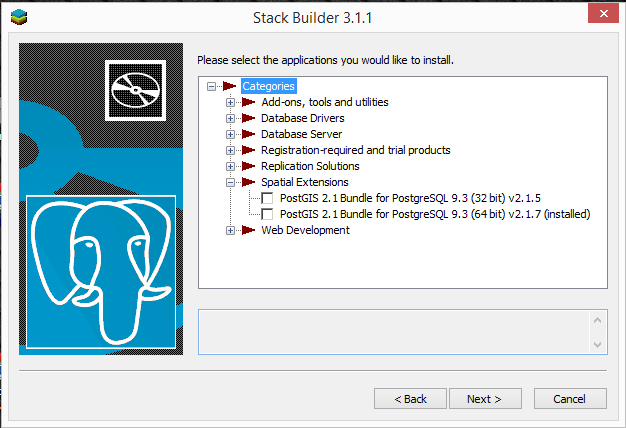
    In order for you to be able to connect to Postgres from QGIS on local host you must ensure 2 things. Firstly that the PostGIS plugin has been installed on your laptop AND secondly that you have included the postgis extension in each database that you wish to connect to. Without enabling the extension in the database you won’t be able to connect OR import shape files. Installation of PostGIS is often a default during the install of postgres but you can check whether this was completed correctly by using the Application Stack Builder, a small program that is installed with later versions of postgres.

    I navigated to this on the win 8.1 machine I was using by using search.

    Opening application stack builder you will be presented with the following.

    ApplicationStackBuilder

    Expand the spatial extensions tree to identify if you already have the PostGIS plugin installed – if not – select as appropriate the plugin and you will be prompted to install. You will need an internet connection for this. Above you can see that my plugin was already installed.

    Next you need to add the PostGIS extension to each Postgres database you wish to link to from QGIS this is done through PG Admin.

    This is something that both myself and a colleague got caught out by and it took me an hour of searching to find how to fix it.

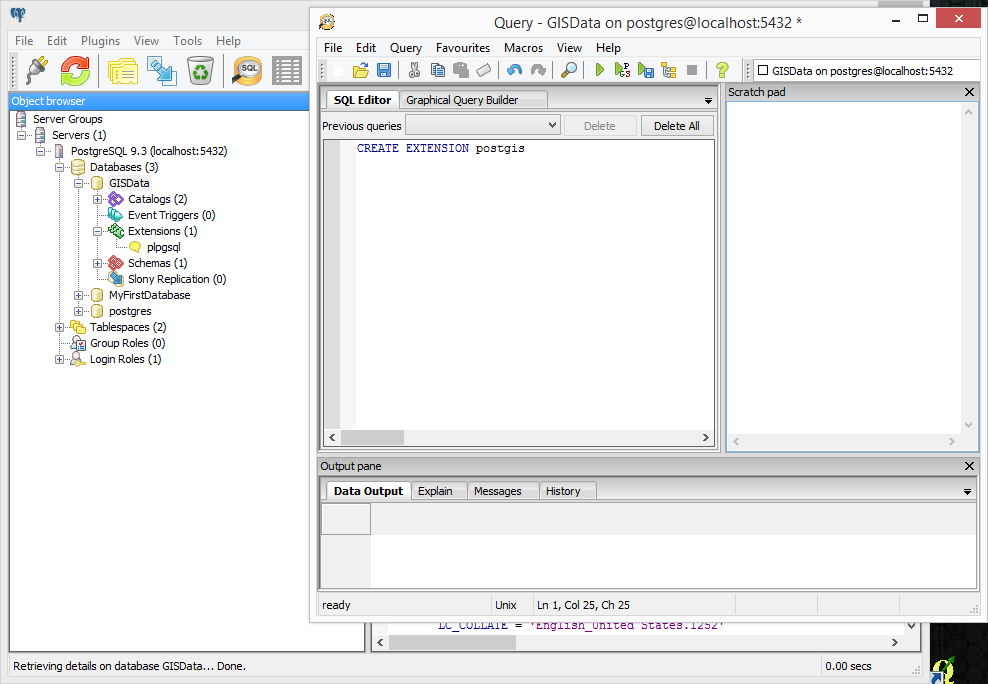
    Below I have a database called GISData which I have just created. You will note there is only one object within the expanded extensions tree. You will not be able to connect to a database that does not include PostGIS in its list of extensions
    CreateExtension

    Hi-light the database you want to spatially enable then go to Tools – Query Tool( Ctrl + E will do the same). In the above picture I’ve slightly jumped the gun. To add the extension to the database type.

    CREATE EXTENSION postgis

    Run the query by selecting the green right arrow
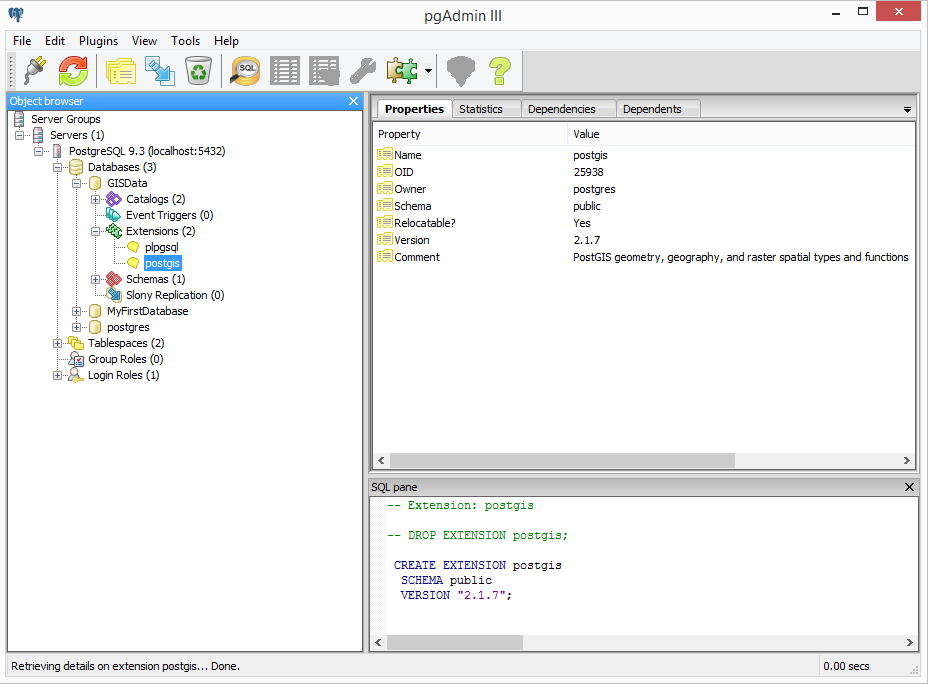
    There will be a short delay and then upon refresh of the connection postgis should appear in the list of extensions.

    CreateExtensionCreated

    You can now close the Postgres administrator and return to QGIS where you should be able to setup the connection to the database.

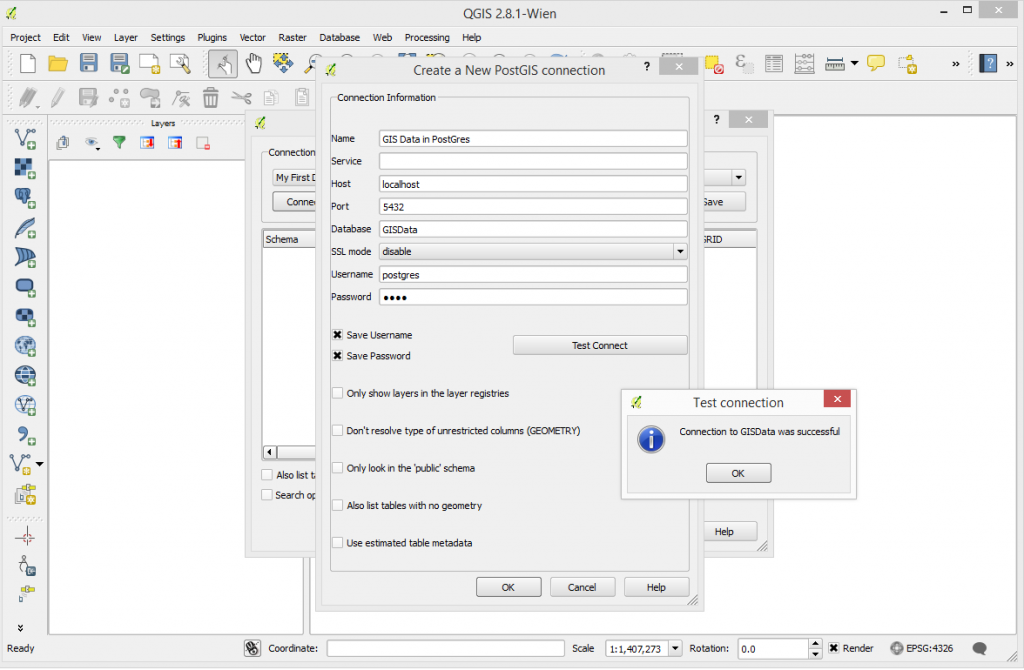
    Parameters should be similar to below and it is useful to test the connection prior to saving.

    SettingupthePostGISconnection